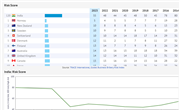
The 2023 TRACE Bribery Risk Matrix Scores measures business bribery risk in 194 jurisdictions, territories, and autonomous and semi-autonomous regions. The overall country risk score is a combined and weighted score of four domains: Business Interactions with Government; Anti-Bribery Deterrence and Enforcement; Government and Civil Service Transparency; and Capacity for Civil Society Oversight, including the role of the media.
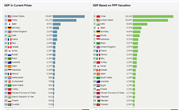
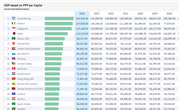
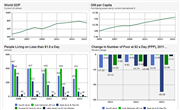
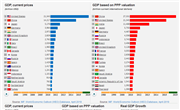
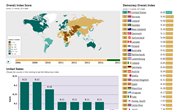
The list of countries by GDP showed on this page is based on the latest data from the World Economic Outlook by the International Monetary Fund. 192 countries from around the world are ranked by GDP measured in US dollars and PPPs from 1980 to 2020. Gross Domestic Product, or GDP, measures the economic size of a country. It shows the total value of all goods and services sold in a country within a particular period of time. One may want to compare countries by GDP to understand which countries are "richest" or have larger markets, i.e. where more goods and services are sold and bought. To make international comparisons possible, GDP should be converted into a single currency because initially, all countries report their GDP in different national currencies. Conversion can be made using current exchange rates or Purchasing Power Parities (PPPs). The world's 10 largest economies in 2020 as measured in US dollars using current exchange rates are the United States, China, Japan, Germany, United Kingdom, India, France, Italy, Canada, and Korea. Using current exchange rates to convert national currencies to US dollars is popular because data on exchange rates are easily accessible but it has a significant drawback. Using current exchange rates for country comparisons by GDP is not correct because exchange rates are often significantly overestimated or underestimated compared to their "correct levels". Correct exchange rate, in turn, should equalize the price levels in two countries. To make it clear, let's assume that the US and Russia, for example, produce only one Big Mac a year each. So, their GDP should be the same and should equal the cost of the Big Mac. Due to the difference in price levels, it costs 130 Rubles in Russia and 6$ in the US. So, the "correct" conversion rate equalizing price levels should be 22 Rubles per 1 USD. Using this conversion rate, the GDP of Russia and the US will be the same and will equal $6 dollars. However, if we use the current exchange rate of 63 rubles per dollar, Russia GDP will be only $2. The conversion rate which equalizes the prices in the two countries is known as the Purchasing Power Parity (PPP). According to this measure, the 10 largest economies in the world are China, the United States, India, Japan, Germany, Russia, Indonesia, Brazil, the United Kingdom, and France. So, based on PPPs, the Chinese economy is bigger than the US economy. Other GDP-related dashboards:Historical GDP by countryHistorical GDP per capita by countryForecast of GDP by countryForecast of GDP per capita by country World GDP per capita rankingWorld GDP
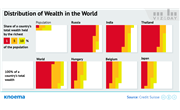
In 2016, just 1 percent of the world's population owned more than 50 percent of the world's wealth. According to the data from the Credit Suisse Research Institute, inequlity of world wealth continues to grow every year. The Institute's assessment is based on a global analysis of national wealth—defined as the value of the financial assets plus real estate (housing) owned by the households, less their debts—and use of the Gini Index, a traditional measure of income distribution and, thereby, inequality. As noted in the Institute’s report:About 3.5 billion people—or, 73 percent of the global population—own less than $10,000.Another 900 million people have between $10,000 and $100,000. This group represents the main driver of growth in demand for goods and services.That leaves the 65 million people globally who eacg possess more than $100,000, including 33 million multi-millionaires who control the bulk of global wealth. An increase in wealth inequity can affect the economy of a given nation by reducing the purchasing power of the main drivers of economic growth. Which countries should be put on notice? Many.While the wealth distribution of countries differs widely, the number of US millionaires, the total population of African adults with wealth under $10,000, and the share of wealth represented by the top-1 percent of Russian citizens are especially noteworthy.Based on the Gini Index alone, many countries of central Europe score the best on income equality. Among the world's major economies, Japan scored the best on the Gini Index, however, the share of the country's population with wealth greater tha $100,000 is still seven times the global average.
(January 2022)The Global Presence Index from the Elcano Royal Institute confirms the downward trend in globalization. The sum of the index value of global presence for all 150 countries had reached its peak in 2018. New data for 2021 show a contraction in this aggregate value of 2.35% with respect the previous year –the largest annual drop for the entire time series.The top 20 ranking is fairly stable, with the same group of countries occupying similar positions for several years in a row and showing that, despite geopolitical and geo-economic changes the West and/or the North still account for a great deal of the aggregate global presence. China gains an enormous volume of external projection and continues to narrow the global presence gap with the US. The index value of Chinese global presence is now 2.3 times lower than that of the US (2.9 times lower only one year before), the latter losing global presence over the past year. The EU records a global presence index value of 3,377 points in 2021, higher than that of the US (3,241) and much higher than that of China (1,365). However, between 2020 and 2021, coinciding with the COVID-19 pandemic but also with the materialisation of Brexit, the EU’s global presence decreases by 300 index value points, while US external projection falls by only 6 points and that of China increases by 62. The Global Presence Index is a synthetic index that orders, quantifies, and aggregates the external positioning of different countries. Global Presence Index is a composite index that assesses 150 countries along three pillars: economic (investments and exports of goods, services and energy), military (troops and military equipment) and soft power (development cooperation, education, science, technology, culture, sports, tourism and migration).
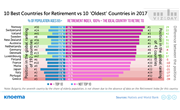
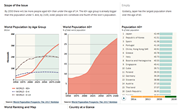
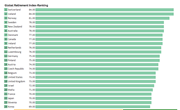
(December 2022) You sometimes hear, “Oh, to be young,” and there is merit to that sentiment depending on where you live out your retirement years. Retirement security is not an issue weighing on individuals alone. It is among the top social issues globally because of a simple fact: the world’s population is getting older. According to the World Bank, the share of people aged 65 and older will double by 2050 to reach 1.6 billion. Societies must grapple with how to ensure people have the resources and services to support themselves through retirement. The Natixis Global Retirement Index (GRI) evaluates 18 performance indicators to provide an in-depth look at four aspects of standard of living in retirement, namely: the material well-being or comfort of living, access to quality health services, access to quality financial services, and a clean and safe living environment. This index is calculated based on data for 44 countries: IMF advanced economies, members of the OECD, and the BRIC countries.According to Natixis’ Index, the top 3 countries by retirement security attractiveness of 2022 are Norway, Switzerland, and Iceland, unchanged from the previous year. Norway won the top in spot because of its high performance in all sub-indices. Norway’s lowest sub-index score was in finance with a score of 69% on a scale from 0-100%, where 100% represents the most favorable environment to retirement security.Ireland, Australia, and Luxembourg have high index scores despite relatively lower positions in finance because of strong performance in healthcare and quality of life dimensions.The BRIC countries scored poorly on the GRI. BRIC countries were the lowest scoring among ranked countries on governance, one of the most important indicators in the finance sub-index calculation.
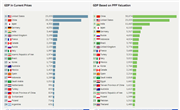
The list of countries by GDP showed on this page is based on the latest data from the World Economic Outlook by the International Monetary Fund. 192 countries from around the world are ranked by GDP measured in US dollars and PPPs from 1980 to 2020. Gross Domestic Product, or GDP, measures the economic size of a country. It shows the total value of all goods and services sold in a country within a particular period of time. One may want to compare countries by GDP to understand which countries are "richest" or have larger markets, i.e. where more goods and services are sold and bought. To make international comparisons possible, GDP should be converted into a single currency because initially, all countries report their GDP in different national currencies. Conversion can be made using current exchange rates or Purchasing Power Parities (PPPs). The world's 10 largest economies in 2020 as measured in US dollars using current exchange rates are the United States, China, Japan, Germany, United Kingdom, India, France, Italy, Canada, and Korea. Using current exchange rates to convert national currencies to US dollars is popular because data on exchange rates are easily accessible but it has a significant drawback. Using current exchange rates for country comparisons by GDP is not correct because exchange rates are often significantly overestimated or underestimated compared to their "correct levels". Correct exchange rate, in turn, should equalize the price levels in two countries. To make it clear, let's assume that the US and Russia, for example, produce only one Big Mac a year each. So, their GDP should be the same and should equal the cost of the Big Mac. Due to the difference in price levels, it costs 130 Rubles in Russia and 6$ in the US. So, the "correct" conversion rate equalizing price levels should be 22 Rubles per 1 USD. Using this conversion rate, the GDP of Russia and the US will be the same and will equal $6 dollars. However, if we use the current exchange rate of 63 rubles per dollar, Russia GDP will be only $2. The conversion rate which equalizes the prices in the two countries is known as the Purchasing Power Parity (PPP). According to this measure, the 10 largest economies in the world are China, the United States, India, Japan, Germany, Russia, Indonesia, Brazil, the United Kingdom, and France. So, based on PPPs, the Chinese economy is bigger than the US economy. Other GDP-related dashboards:Historical GDP by countryHistorical GDP per capita by countryForecast of GDP by countryForecast of GDP per capita by country World GDP per capita rankingWorld GDP
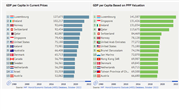
GDP per capita determines the level of economic development of the country: the higher the GDP per capita in a country the higher the economic wealth of its citizens.Since the beginning of the century, Luxembourg, Switzerland, and Norway have the sustainable high positions of GDPs per capita at current prices with Luxembourg being the leader.GDP per capita based on purchasing power parity (PPP) is a more accurate characteristic determining the level of economic development and economic growth. Based on this approach, Qatar has the highest GDP per capita in the world while Luxembourg ranks second. According to the definition given by Global Purchasing Power Parities and Real Expenditures International Comparison Program, purchasing power parity (PPP) between two countries, A and B, is the ratio of the number of units of country A’s currency needed to purchase in country A the same quantity of a specific good or service as one unit of country B’s currency will purchase in country B. PPPs can be expressed in the currency of either of the countries. In practice, they are usually computed among large numbers of countries and expressed in terms of a single currency, with the US dollar (US$) most commonly used as the base or "numeraire" currency. Other GDP-related dashboards:Historical GDP by countryHistorical GDP per capita by countryForecast of GDP by countryForecast of GDP per capita by country World GDP rankingWorld GDP
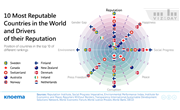
In 2016, the Reputation Institute ranked Sweden, Canada, and Switzerland as the most reputable countries in the world. The Institute's ranking is based on the collective opinions of 48,000 people surveyed throughout the G8* countries. According to the Reputation Institute, a country has a strong reputation if people perceive the country as having an advanced economy, appealing environment, and effective government or admire, trust, or feel esteem toward the country. These perceptions and feelings are based on people's direct experience, stereotypes, and the country's actions.Positive experience and stereotypes are the result of a country's performance across social, political, and economic spheres. Nine of the 10 most reputable countries are considered to be among the happiest nations in the world; eight of the 10 have the highest social progress and lowest corruption levels worldwide; and six of the 10 score highest on transparency in the media ratings.Top ranked Sweden has the highest ratings worldwide on press freedom, environmental performance, and gender equality. As for other top ranking countries, Canada is rated high in social progress, Switzerland in happiness, and Australia in peace. Once achieved, intangible respect has quite a tangible economic effect for a country. Researchers from the Reputation Institute claim that the country's reputation affects positively its tourism, exports, foreign investment, and inflow of high-skilled workers.Ireland, Switzerland, and the Netherlands appear to be evidence of this relationship. Each is among the top 10 countries worldwide by value of exports and foreign direct investment per capita.New Zealand, Switzerland, and Norway are among the top ranked countries by employment of foreign-born populations with high educational attainment. * The G8 countries are: Canada, France, Germany, Italy, Japan, Russia, the United Kingdom, and the United States.
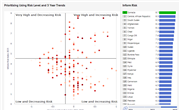
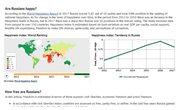
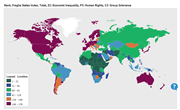
According to the INFORM Risk Index 2023 developed by the Joint Research Center of the European Commission, twenty countries today are facing a very high risk of humanitarian crisis compared to fourteen countries last year. Comparison of the current level of INFORM Risk Index and its trend over previous years there are twelve countries that are exposed to the very high and increasing risk of humanitarian crisis including Somalia, South Sudan, CAR, Ethiopia, Sudan, Uganda, Burkina Faso, Iraq, Haiti, Cameroon, Myanmar and Kenya. INFORM Risk Index is a composite indicator that identifies countries at risk of humanitarian crisis and disaster that would overwhelm national response capacity. The INFORM model is based on risk concepts published in scientific literature and envisages three dimensions of risk: Hazards & exposure, Vulnerability, and Lack of coping capacity. The INFORM model is split into different levels to provide a quick overview of the underlying factors leading to humanitarian risk and builds up the picture of risk by 54 core indicators.
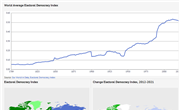
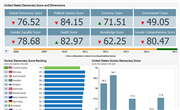
The Elected Democracy Index constructed by Our World in Data (OWID) indicates that the world has become less democratic in recent years.According to OWID estimates in 2021 countries received an electoral-democracy score of 0.51 on the scale from 0 to 1. This score is slightly lower than the highest ever average of electoral democracy (0.53) in 2012.The number of countries that are autocratizing has been increasing: in 2021, 30 countries were autocratizing, remaining close to the all-time high of 31 countries in 2019. For a long time, the number of autocratizing countries was offset by a larger number of democratizing countries. But since 2011, the number of countries that are becoming less democratic has been higher. Electoral Democracy Index from Our World in Data is based on the expert assessments and index by V-Dem.It captures to which extent political leaders are elected under comprehensive voting rights in free and fair elections, and freedoms of association and expression are guaranteed. It ranges from 0 to 1 (most democratic).
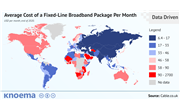
(28 October 2021) In the modern digital world, access to the internet is increasingly becoming a basic human need. A worldwide broadband pricing report from Cable.co.uk shows how much the price for internet access varies across countries. Some key takeaways:The world's cheapest fixed-line broadband is currently offered in Ukraine, with an average monthly cost of US$6.40 per month. Five of the ten countries with the cheapest internet were formerly part of the USSR: Ukraine, Russia, Kazakhstan, Moldova and Belarus.The world's most expensive country for fixed-line broadband is Eritrea, with an average package price of $2,666 per month. Eritrea is also the most expensive country in terms of internet speed, with users paying an average monthly cost of of $1,590 per megabit per second (Mbps)—more than seven times the monthly cost per Mbps in the next most expensive country, Niger.The country with the lowest cost/speed ratio is Romania, with an average cost of $.02 per Mbps per month. Of the 211 countries covered in the report, 87 (41%) have average costs per Mbps less than $1.00 per month, and users in 171 countries (81%) pay less than $10 per Mbps per month.The US is ranked at 131st place globally among countries with the cheapest internet, with an average package cost of $60 per month. On the Mbps cost scale, though, the US is ranked at 26th place globally.
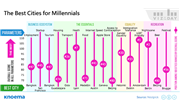
Millennials are marked for their affinity with media and digital technologies and the consequent positive effect on policy and economy of cities they live in. The migration of individuals of this generation is thus of high interest to everyone from city planners and real estate agents to corporations with long supply chains to recalibrate to the demands of evolving city demographics.Millennials—those aged 17-37 years, i.e. born between the early 1980s to early 2000s—constitute roughly one-third of the world's population, or 2.5 billion people.Individuals from this generation tend to move more often than other generations, a tendency attributed to their highly expectant standards. According to the United Nations Development Programme, millennials represent more than one-third of the world's total international migrant stock. The tendency of millennials to city hop begs the question, which cities most attract millennials and why? Nestpick—a service that helps people find apartments around the world—has developed a Millennial Cities Ranking that includes 100 cities from 40 countries worldwide. The 'best’ cities for millennials assumes good performance across all 16 of the factors it ranks, which are broken down into four categories: business ecosystem, affordable access to the essentials, openness and tolerance, and recreation facilities.*According to the Nestpick, Amsterdam is the perfect city for millennials. The city is perceived as LGBT friendly, has affordable housing, and boasts a lively night scene. Moreover, 29 percent of Amsterdam's population is foreign-born as of 2016, which means that many people have already relocated to this dynamic city. While Amsterdam has the highest overall score, it is highest ranked in only one of the 16 factors - LGBT friendliness. A variety of cities rank higher on a factor-by-factor basis: Bangkok for employment; San Francisco for startups, Medellin by cheap food, and Beijing by beer, for example.Almost all of the top cities from Nestpick score well among other global rankings. For example, Amsterdam was ranked 26th in the Global Cities Index by Bloomberg and the Global Cities Liveability ranking by the Economist Intelligence Unit. Explore today’s Viz and see how cities in your area rank in terms of the millennial appeal.
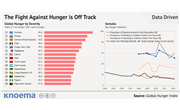
(19 October 2021) In mid-October the Global Hunger Index released its annual report, which estimates progress in fighting hunger in more than one hundred emerging and developing economies. According to the 2021 Global Hunger Index report, the world will fail to achieve a low level of global hunger in the next decade. Here are key takeaways:The progress in fighting hunger made in recent years can be quickly wiped out by armed conflicts, climate change and the COVID pandemic. The global economy and the world's agricultural and food systems remain highly vulnerable to the consequences of climate change and contagious diseases.According to 2021 estimates, Somalia is the only country currently suffering from an "extremely alarming" level of hunger. An "alarming" level of hunger is observed in 5 countries — Central African Republic, Chad, Democratic Republic of the Congo, Madagascar, and Yemen. The report identifies the hunger level as "serious" in 31 countries.Over the last decade (2012-2021), hunger increased in 15 countries. The highest increase in hunger index score was observed in Venezuela, where the socio-economic crisis has significantly exacerbated the problem of hunger. Eighty-four countries saw improved hunger levels. Though Somalia made the greatest progress in decreasing hunger, with its hunger index score dropping from 65.1 to 50.8, the severity of hunger in this nation has stayed at extremely high levels for the last two decades. Note: Global Hunger Index scores are calculated from four indicators: undernourishment; child wasting; child stunting; child mortality.
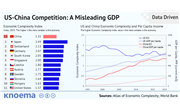
(23 September 2021) Gross Domestic Product (GDP) has for years been the key economic indicator used for cross-country comparisons. The value of GDP shows how large a country's economy is, and per capita GDP is used to compare countries' productivity and technological development. However, emphasis on these directly measurable indicators often obscures qualitative characteristics of development that can significantly affect the estimates of a country's economic potential.With China becoming an economic superpower, comparison of US and Chinese economic strength has become a regular exercise for experts and research institutions. Such exercises often prioritize cross-country GDP comparison, which shows that China's economy today is 33% smaller compared to the U.S. economy, and shows an even wider gap in productivity/technological development. The most optimistic (for China) calculations indicate that China's GDP per capita is 75% smaller than that of the U.S. However, there are other metrics showing China's capability to challenge the position of the U.S. in the global economy. For example, data from the World Bank shows that China produces two times more industrial goods than the U.S. In addition, trade statistics show that China has closer trade ties with the rest of the world than the United States.But quantity is not the only factor. The gap in economic power between the U.S. and China looks much closer than GDP and productivity data shows when technological and innovation potential is accounted for through indirect measures. For example, the Economic Complexity Index constructed by Harvard’s Growth Lab suggests that China has almost caught up with the United States in the ability to sustain a diverse range of productive know-how, including sophisticated, unique capabilities, and to produce complex products that few other countries can make.
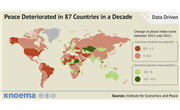
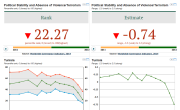
(30 June 2021) While it’s true that major powers aren’t engaging in the kind of devastating large-scale wars that rocked the first half of the 20th century, data from the Institute for Economics and Peace shows that the state of global peace is deteriorating. According to the Institute's 2021 Global Peace Index report, between 2012 and 2021 the peace index score deteriorated in 87 countries (out of 158 for which 2012-2021 data is available), including the three major military powers: the US, Russia, and China. Ongoing militarization is the main factor in the major military powers' worsening scores.Over the past seven years, the United States has become one of the fastest militarizing countries, registering the third-largest change in militarization score from 2014 to 2021 after the UAE and Eritrea. China and Russia are 70th and 81st, respectively, in change in militarization over the same time period.Although the overall change in the global peace index from 2020 is relatively small, only .07%, the report notes that 2021 is the ninth out of the past thirteen years to register a net decline in global peacefulness. The Global Peace Index Report measures global peacefulness based on 23 indicators grouped into three domains: Societal Safety and Security, Ongoing Domestic and International Conflict, and Militarization. A lower score indicates a greater degree of peacefulness, while a higher score indicates less peaceful conditions.
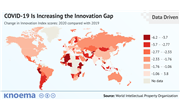
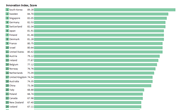
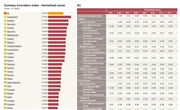
(24 March 2021) According to WIPO's 2020 Global Innovation Index report, Switzerland, Sweden, the US, the UK, and the Netherlands continue to lead the innovation ranking in 2020, with a second Asian economy—the Republic of Korea—joining the top 10 for the first time (Singapore is number 8). High-income countries held all of the top 10 spots again this year; however, China has retained its place among the 15 most innovative economies, ahead of some countries from the high-income group such as Japan and Canada.While the COVID-19 crisis has catalyzed innovation in many sectors, such as IT, fintech, health, education, tourism, and retail, the pandemic's overall impact on innovation activity has been negative. Average Innovation Index scores were lower in 2020 than in 2019 across all world regions and income groups.However, the pandemic has disproportionately hindered innovation in developing economies. In low-income and lower-middle-income countries, the 2020 average Innovation Index score declined by 2.5 and 3.7 points, respectively, compared to previous year. In high-income countries, the average score decreased by only 1.8 points compared to 2019. The growing innovation activity gap between developed countries and the rest of the world poses a serious threat to the goal of closing the income gap between high-income and low-income countries, which is a part of the global development agenda under the UN Sustainable Development Goals initiative. Notes: World Bank Income Group Classification Based on Gross National Income Per Capita: Low income -$1,025 or less; Lower-Middle Income $1,026-$3,995; Upper-Middle Income $3,996-$12,375; and High Income equal or more than $12,376.
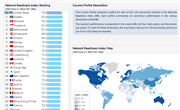
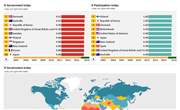
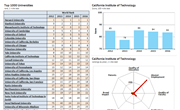
Starting in 2001, the Global Information Technology Report series published by the World Economic Forum in partnership with Cornell University and INSEAD measured the drivers of the information and communications technology (ICT) revolution using the Networked Readiness Index (NRI). In 2019, the NRI was redesigned by Portulans Institute and its name updated to Network Readiness Index. The 2020 NRI, the second edition of the renewed methodological model, places the main focus on Digital Transformation. The approach reflects a focus on effective integration of people and technology that influences our economy, society and the environment appropriately. The redesigned model ranks a total of 134 economies based on four pillars: Technology, People, Governance, and Impact.Technology. Technology is the backbone of the networked economy. This component assesses the level of technology that is a prerequisite for a country's participation in the global economy.People. The availability and level of technology in a country is of interest only if people and organizations have access, resources, and skills to use the technology productively. This component assesses the use of ICT by people: individuals, businesses, and governments.Government. The government component reflects the trust associated with security and privacy beliefs and the degree to which participation in the networked economy is regulated.Impact. Impact measures the readiness of the networked economy by assessing the economic, social, and human impact of participation in the networked economy.
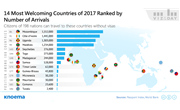
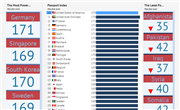
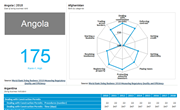
Modern and legacy political and military relationships, business investment, and other factors weigh on the power of one’s passport, making the list of least and most welcoming countries globally highly dependent on your citizenship. For example, a German passport holder gains access to more countries than travelers on Chinese or Senegalese passports. However, that same German passport holder cannot visit Equatorial Guinea without a visa while a Chinese passport holder may enter. No matter your nationality, 11 countries will welcome you without a visa, making these countries the “most welcoming”, according to the Arton Capital's Passport Index. The list of most welcoming countries is dominated by African nations. Despite visa-free access, only four—Cote d'Ivoire, Mozambique and Maldives—are relatively frequently visited by tourists. Each has more than 1 million international tourist arrivals per year, which ranks them among the top 100 destinations in the world.On the flip side, think twice before booking tickets to Afghanistan, North Korea, Somalia, Syria, or Turkmenistan without a visa or other special documents (such as a diplomatic mission). You could add Angola to this club as well; only citizens of Namibia may enter without a visa or other official permission. How powerful is your passport? Explore the power of your passport here.
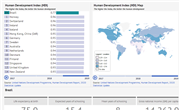
(3 March 2021) The latest Human Development Report (HDR), published by the United Nations Development Programme (UNDP) in December 2020, is the 30th-anniversary edition of this study. The 2020 edition, which analyzes data for 2019, stresses the importance of minimizing the pressures exerted by people on the planet while advancing human development. These pressures have increased interactions between humans, livestock, and wildlife, squeezing local ecosystems in ways that enable deadly viruses like COVID-19 to emerge more frequently. The rapid spread of COVID-19, in turn, exacerbated numerous inequalities in human development. The Human Development Index (HDI) is a composite index used by UNDP to reflect the achievements of countries and regions in three key fields of human development: healthy life, knowledge, and a decent standard of living. The chief aim of the HDI is to provide nations with a comprehensive measure of the opportunities for personal fulfillment available to their people. The higher the country's HDI, the better the conditions in which its citizens live and work. The HDI is calculated on the basis of three indices: the life expectancy index, education index, and GNI index. Since this calculation captures only a part of what human development entails, the HDR also offers additional composite indices on other critical issues of human development: a gender inequality index, gender development index, red list index, environmental performance index, export concentration index, and more. Key findings from the latest report:In 2019, a few countries saw a drop in HDI ranking. Among them are Venezuela, Belarus, the Russian Federation, India, Brazil, Germany, and Belgium. Venezuela experienced a dramatic fall in the rankings on 12 of the indices due to the worsening economic situation.The HDI growth of the medium human development group decreased three years in a row and showed negative growth in 2019. The HDI growth for the high human development group remained almost stable, while the very high human development and low human development groups experienced rapid HDI growth in 2019.The HDI 2020 report emphasizes the increased importance of climate change and biodiversity loss issues, stating that countries with very high human development are the biggest CO2 emitters. In contrast, countries with low human development emit the least carbon dioxide but generally have a higher degree of environmental degradation.
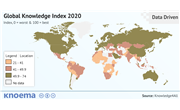
The Global Knowledge Index (GKI) from Knowledge4All has emerged as a replacement to the World Bank's well known Knowledge Economy Index, 2012. The purpose of the GKI is to capture the multidimensional nature of knowledge (often linked to related concepts such as 'knowledge economy' or 'knowledge society') and help guide policymakers and researchers in their efforts to foster knowledge-based societies and bridge knowledge gaps that help propel development and economic growth.The GKI is a joint initiative between the United Nations Development Programme (UNDP) and the Mohammed Bin Rashid Al Maktoum Knowledge Foundation (MBRF). The index measures the knowledge performance of countries based on each country's general 'enabling environment' as well as seven other components: pre-university education, technical and vocational education and training, higher education, research, development and innovation, information and communications technology, and the economy.Whereas the World Bank index was primarily focused on the components that directly related to the knowledge economy formation, the GKI goes beyond the economic aspect and encompasses the factors of education, economy, innovation, and the enabling environment.
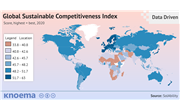
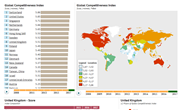
(3 February 2021) The competitiveness of Eastern European and some African countries may be underestimated while that of the world's top economies, like the United States and Singapore, overestimated. Wonder why? We'll give you a clue: sustainability. The Global Sustainable Competitiveness Index (GSCI) by SolAbility* is one of multiple measures available today to estimate the competitiveness of countries. Others include the Global Competitiveness Index (GCI) by the World Economic Forum (WEF) and the World Competitiveness Ranking by IMD. As its unique feature, SolAbility claims that the GSCI captures real competitiveness by integrating three dimensions of sustainable development: society, the environment, and the economy. The GSCI may be better aligned with ESG investing as it takes into account the framework that enables and defines the current situation rather than describing symptoms. Comparing SolAbility's index and that of the WEF for 2019 reveals commonalities and deviations although, on net, the two measures are positively correlated.The top spots in both indices are dominated by European and, in particular, Northern European countries, such as Sweden, Denmark, and Finland.The SolAbility GSCI demotes some countries relative to their strong performances in the WEF GCI, notably including the United States and Singapore, which ranked 32nd and 44th, respectively. And, they aren't the only ones - Japan and Australia also underperform on the GSCI.In contrast, some Eastern European countries, including Croatia, Latvia, and Estonia, have stronger results in the GSCI, each ranking in the top 10 despite falling outside even the top 30 in the GCI. Some of the world's least developed economies are right there with them; Ethiopia, Bolivia, and Paraguay each earned considerably higher GSCI rankings than their GDPs or the GCI would otherwise suggest. *SolAbility is a Swiss-Korean sustainable intelligence think-tank providing expert sustainability solutions for corporate clients and ESG research for institutional investors.
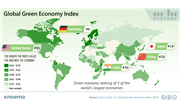
While mainstream media outlets globally may be focused on the relationship between climate change and extreme weather, crop performance, and infrastructure resilience, economists and business strategists alike are turning toward greener measures and outlooks of economic performance. The 2018 Global Green Economy Index (GGEI) by Dual Citizen LLC is one of several initiatives—others include the Green Growth Knowledge Platform and the UN Partnership for Action on Green Economy—working to provide policy guidance, promote good practices, and generate and promote the data necessary to inform decisions on policies and investments necessary for accelerating the green transition. The GGEI 2018 measured the green economic performance of 130 countries across four dimensions: leadership and climate change, efficiency sectors, markets and investment, and the environment.In today’s Viz of the Day, we showcase the 2018 GGEI overall results—spoiler alert, Sweden is top ranked, again—with a special data feature on the performance of five the world’s largest economies on a specific dimension of the index: Markets & Investment. Markets & Investment Highlights The GGEI 2018 results below show that a decade post the first global green economy initiative from the UN Environmental Program, even the world’s largest economies have made uneven progress toward the investments and policies required to support a green economy transition. Among five of the world's largest economies, Germany has the strongest performance in the overall index (ranked 6th), followed by Japan (19th), China (28th), the United States (31st), and India (36th).Turning to Markets & Investment, Japan notably outranked other large economies according to GGEI’s corporate sustainability measure. This calculation covers the policies of large market cap companies in each country in terms of (i) disclosing climate change data to leading certification authorities; (ii) the rating of companies by those authorities; and (iii) commitment to science based targets to reduce greenhouse gas emissions.Unsurprising to those who follow the renewable energy sector, China outperformed in net 5-year installed renewable capacity. You can explore this topic further in our recent viz exploring renewable power installation globally and the phenomenon of negative energy prices in Europe.
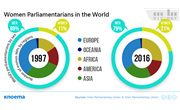
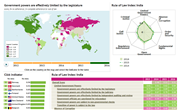
Politics has long been considered as a 'man's world.' Even today, women remain significantly underrepresented in legislative and executive branches of government globally despite research that suggests a strong connection between women in leadership and economic and democratic gains.Today one-fifth of the world's parliamentarians and less than one quarter of national leaders are women. Rwanda, Cuba and Bolivia have the highest share of women parliamentarians, however, Europe has traditionally maintained the highest representation of women in government. As of June 2016, the ratio of men and women lawmakers in Belgium, Sweden, Finland, and Iceland was about three to two.Countries of Asia and Oceania demonstrate persistent underrepresentation of women, despite progress made toward changing the political landscape during the last twenty years. Statistics suggest that past gender disparities may be eroding as more and more women have risen to positions of power. During the last two decades, the share of women parliamentarians in the world has doubled, increasing from 10.8 percent in 1997 to 21.2 percent in 2016. On the whole, all countries to greater or lesser extents increased women's participation in their respective political systems during the reference period with the exception of only nine countries, among which North Korea performed the worst.African countries, especially Ethiopia, Rwanda, and Senegal, witnessed particularly significant progress in empowering women within government ranks. In the Arab States, progress has been uneven. While the United Arab Emirates and Syria made gains in 2016, there was no change in the male-female distribution in the parliamentary chambers of Kuwait or Qatar. In Kuwait, one woman has been the exclusive female representative in parliament for several years, while Qatar remains the only country in the region committed to a male-only parliament. Research supports a link between countries in which women are empowered as political leaders and higher standards of living. As such, the argument can be made that measures should be taken to encourage development of women into political leaders to build sustainable democracies and meet global development goals. Research shows a positive relation between the share of women parliamentarians and GDP per capita. In addition, as more women are elected to office, there is a corresponding shift in policy priorities toward family, women, and ethnic and racial minorities that bolsters democratic values.
The 22nd session of the Conference of the Parties (COP 22) to the UNFCCC is scheduled to take place from 7-18 November 2016. During COP 22, parties will, inter alia, begin preparations for entry into force of the Paris Agreement. Event Holder: International Institute for Sustainable Development Source of data: World Development Indicators, July 2016; World Bank Climate Change, 2015; Environmental Performance Index, 2016; Greenhouse Gas Emissions.
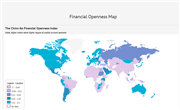
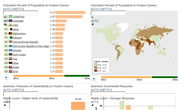
The Chinn-Ito Index (KAOPEN) measures a country's degree of capital account openness. The index was initially introduced in Chinn and Ito (Journal of Development Economics, 2006). KAOPEN is based on the binary dummy variables that codify the tabulation of restrictions on cross-border financial transactions reported in the IMF's Annual Report on Exchange Arrangements and Exchange Restrictions (AREAER):European and North American countries as well as advanced countries in other parts of the world like Australia, New Zealand, Korea, and Japan were the most open in 2017 in terms of the capital account.A few countries in Africa performed especially well relative to other economies worldwide, including Uganda, Zambia, Botswana.50 countries of 174 countries achieved the highest index value to share the top ranking in 2017.
If you’re a frequent international traveler, you probably look forward to the next stamp that will be added to the collection of pages inside. But as you approach airport security, clutching the document in your hand, have you ever wondered just how powerful it is? The answer depends on your passport’s country of origin. A tool called Passport Index aims to help curious travelers rank countries based on how easily their citizens can travel the globe. According to the system, passports accumulate points for each country their holders can visit without a visa. When totaled, the sum equals the passport’s “Visa Free Score.”
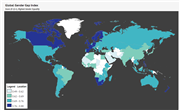
Gender inequality arises from differences in social, political, and civil rights between men and women and has persisted in various forms since ancient times. The Global Gender Gap Report states that none of us will see gender equality during our lifetimes. If true, this will mean a perpetuation of stunted economic development. Without the full deployment of roughly half of the world’s total talent pool, full competitiveness and future-readiness of the world's economies and businesses are simply unachievable.
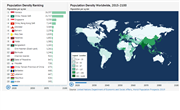
Between 2015 and 2100 the top 5 most populous countries worldwide is expected to remain fixed, according to data from the UN Department of Social and Economic Affairs.Monaco, with a total population of nearly 38,000 in 2015, is currently the world's most densely populated country at 25,332 people per square kilometer (sq km), a figure expected to grow to roughly 37,000 per sq km by 2100. The only new entrants to the top 10 list of most populous countries through 2100 are the State of Palestine, Burundi, and the island country of Mayotte. Africa's anticipated population boom will shake up the top 20 and move Nigeria - the continent's most populous country - up from the 65th to 21st most densely populated country worldwide. Other African countries, however, will surpass Nigeria by population density, including Burundi, Comoros, Malta, Rwanda, Uganda, Malawi, and Gambia. In contrast, spacious countries in different stages of their demographic transitions will move around in the rankings but remain well within the crowd of the lower population density countries. By 2100, the population density of the United States is expected to increase slightly from 173rd to 170th place - an increase of about 14 people per sq km - while in Russia the population density is expected to decrease slightly moving it from 212th to 217th position, or a decrease of about 1.6 people per sq km.
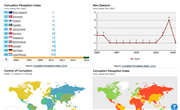
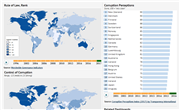
Every year Transparency International - the global coalition against corruption publishes Corruption Perception Index in countries around the world. Denmark and New Zealand top again with "very clean" scores over 90/100. The main reason of countries' success is strong inland corruption control. Let's remind some basic facts about the index:CPI is a business measure, addressed primarily to media and other expert people. Ordinary people are not really counted in, nor much affected by references.CPI pertains exclusively to public sector corruption, leaving aside whatever happens amids private settings.Up until 2012, the way CPI was constructed implied country's ranks could not be compared across time.CPI methodology used 12 different data sources from 11 different institutions (one less than in 2013), and a minimum of three sources is required for a country to be included in the index. Source: Corruption Perceptions Index
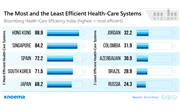
The Russian health-care system is one of the least efficient in the world, but how inefficient is it? As low as it gets within the universe measured by the Health-Care Efficiency Index from Bloomberg. This year’s Index scored Russia as the least efficient of the 55 countries covered.Jordan, Colombia, Azerbaijan and Brazil rounded out the bottom five, with the US not far behind, scoring 50th in the ranking.The index evaluates data for countries with populations of 5 million people or more, GDPs per capita of at least $5,000, and population life expectancy over 70 years, with a weight assigned to each measure. Life expectancy is weighted heaviest at 60 percent of the total score. While life expectancy remains one of the best indicators of health-care efficiency, it is also slow to change. Shifts in the results of the Index stem largely from growth in health expenditures. To the extent that governments play a leading role in regulating and providing healthcare, government intervention has a stronger influence in the index results.
In order for the countries to perform sustainable development over times in all spheres of people's lives without imbalances adequate long-term strategic plans for the future are necessary to be elaborated. Development strategies will be of true benefit only in case if they are based on robust and reliable statistical tools, allowing to conduct comparative analysis of country's performance in all key fields of human being and over time. As of today, it is known lots of such tools most of which represent some kind of special indices measuring countries' performance in that or another field in comparison to the other countries. Since such indices are based on cross-country comparisons a lot of robust country-level statistical data is needed, which can only be obtained by large international organizations, such as the World Bank, United Nations, Freedom House, World Economic Forum, Transparency International and others. They have developed a range of indices such as Human Development Index, Democracy Index, Knowledge Economy Index, Corruption Perceptions Index, Press Freedom Index and so on. Those of them, which are in open access, are available on our site and you can easily explore them through the page below by way of data or visualizations ready for analysis. See also: Agriculture | Commodities | Demographics | Economics | Education | Energy | Environment | Exchange Rates | Food Security | Foreign Trade | Healthcare | Land Use | Poverty | Research and Development | Telecommunication | Tourism | Transportation | Water | World Rankings
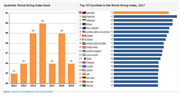
The Charities Aid Foundation (CAF) World Giving Index examines how and why people around the world give to charity. The featured charts illustrate the World Giving Index scores of the Top 20 Countries based on responses related to three charitable behaviors: Helping a stranger Donating money Volunteering time
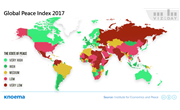
The 2017 Global Peace Index reflects the reality of war and peace today with Syria, Afghanistan, and Iraq ranking as the least peaceful countries of the 161 evaluated for the index. The United States experienced the greatest decline in the index since last year, slipping 11 places to rank 114th, directly following Armenia and Rwanda and preceding El Salvador and China.But, what’s in the index? The Global Peace Index is comprised of 23 indicators grouped into three broad themes: the level of safety and security in a society, the number of international and domestic conflicts, and the degree of militarization. In the US case, the deterioration of its score is attributable to an increasing homicide rate and the number of terrorist attacks and mass shootings last year.Nearly 60 percent of the Index countries improved their scores in the 2017 edition, with Europe remaining the world’s most peaceful region. Only Canada and Australia also made the top 10.Learn more about the performance of specific countries on each of the three components of the index: ongoing domestic and international conflict; societal safety and security; and militarization.
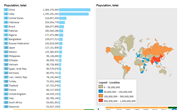
China PopulationIndia PopulationUSA PopulationIndonesia PopulationBrazil Population World PopulationPakistan PopulationNigeria PopulationBangladesh PopulationRussia PopulationJapan Population World Population Ranking
HelpAge International has created the Global AgeWatch index to give voice to older people in defining the post-2015 UN sustainable development goals. This index assesses 96 countries worldwide on how well they provider their aging populations with decent, active, and healthy lives and enable policymakers to make the necessary steps to improve the well-being of older people. The welfare of older people globally is important not only because of the expected growth of this age group in the decades to come but because people do not stop developing when they reach ago 60. Older population have the same rights as younger people to live in environments that foster this development.
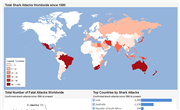
Since the beginning of the 20th century, shark attacks on human populations have increased considerably. The total 98 unprovoked attacks confirmed in 2015 is the highest on record, surpassing the previous high of 88 attacks recorded in 2000. According to the International Shark Attack File - the only globally-comprehensive, scientific shark attack database in the world - the most attractive terrains globally for attacks are coastal areas of the United States, Brazil, South Africa, and Australia. In 2015, 164 total shark attacks were confirmed worldwide. Sixty percent (98 attacks) were unprovoked attacks. A majority of the other shark attacks were either provoked (36 attacks) or occurred between a shark and a vessel (14 attacks), with a handful of cases attributed to sunken ships or downed aircraft, known a "air-sea disaster," or post-mortem bites, referred to as "scavenge" attacks. Some cases were inevitably indeterminate, if there was insufficient original evidence available to verify a shark attack, or misclassified as shark attacks when the incidents were actually attributable to other or unknown marine life. As shark attacks become more common, the delicate coexistence of humans and sharks in popular offshore areas is in the balance. Multiple factors have contributed through time to the number of recorded attacks and could help to inform warnings for coastal areas.Recent evidence suggests that global warming may be pushing sharks closer to shore as new, warm water habitats open up to them, increasing the rate of interactions between humans and sharks. Some researchers have also connected shark attacks on humans to the rising population of female sharks, which dramatically increased beginning in the mid-1930s.Shifts in available food sources also influence sharks' diets. Researchers have linked the spike in shark attacks in the coastal areas of New Jersey, USA, in 1916 to increased consumption of humans as a result of the casualties of the First World War. Today, conservation specialists are concerned that global warming could be reducing the supply of traditional food sources for shark populations, forcing them into new areas to survive.
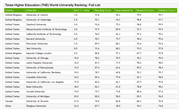
The list below includes top 1,000 universities in the world as per the most recent World University Rankings 2019 by Times Higher Education (THE). Overall universities' performance score is assessed based on the following parameters:The learning environment (teaching score);Volume, income, and reputation of research (research score);Research influence (citations score);International staff, students and research (international outlook score);Knowledge transfer (industry income score). To view rankings for previous years starting from 2011, use drop-down lists below.
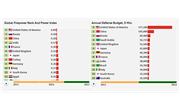
Global Firepower (GFP) provides a unique analytical display of data concerning today's world military powers. Over 100 world powers are considering in the ranking which allows for a broad spectrum of comparisons to be achieved concerning relative military strengths. The Global Firepower ranking is based strictly on each nations potential conventional war-making capabilities across land, sea and air. The nuclear capability is not taken into account. The final ranking also incorporates values related to resources, finances and geography. The Global Firepower ranking is based on a formula utilizing over fifty different factors, compiled and measured against each nation. Bonuses (ex: low oil consumption) and penalties (ex: high oil consumption) are applied to further refine the list. The finalized GFP value is recognized as the "Power Index" which supplies a nation its respective positioning in the rankings. Power Index & Country Ranks Man Power Land Systems Air Power Naval Strength Compare Countries
The Democracy Ranking compares the development of quality of democracy in 112 countries during the years 2008-2015. It is based on the following dimensions: politics, economy, ecology and environment, gender equality, health and health status, and knowledge. The possible values that a country can achieve go from 1 (minimum) to 100 (maximum).
On 31 October 2003, the General Assembly adopted the United Nations Convention against Corruption and requested that the Secretary-General designate the United Nations Office on Drugs and Crime (UNODC) as secretariat for the Convention’s Conference of States Parties (resolution 58/4). The Assembly also designated 9 December as International Anti-Corruption Day, to raise awareness of corruption and of the role of the Convention in combating and preventing it. The Convention entered into force in December 2005. The United Nations Convention against Corruption is the only legally binding universal anti-corruption instrument. The Convention's far-reaching approach and the mandatory character of many of its provisions make it a unique tool for developing a comprehensive response to a global problem. The vast majority of United Nations Member States are parties to the Convention. The text of the United Nations Convention against Corruption was negotiated during seven sessions of the Ad Hoc Committee for the Negotiation of the Convention against Corruption, held between 21 January 2002 and 1 October 2003. The Convention covers five main areas: preventive measures, criminalization and law enforcement, international cooperation, asset recovery, and technical assistance and information exchange. The Convention covers many different forms of corruption, such as bribery, trading in influence, abuse of functions, and various acts of corruption in the private sector. Date of Event: 9 December 2018
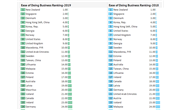
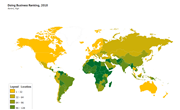
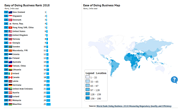
Highlights:New Zealand took first place this year. Rounding out the list, Somalia was rated as the toughest environment for business. Several other African nations were included among the most challenging business environments globally. To view a detailed ranking by indicator, select your country on the world map. Data Source: Doing Business, published by World Bank
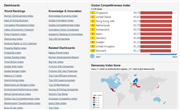
The Global Competitiveness Index (GCI) is a global study on the basis of which ranking of countries in terms of economic competitiveness in the world is formed. The World Economic Forum defines competitiveness as the ability of the country and its institutions to ensure stable economic growth, which would be stable in the medium term. GCI is determined by numerous and very diverse factors which were divided into three subindexes: Basic requirements, Efficiency enhancers, Innovation and sophistication factors. The index is composed of 12 pillars of competitiveness. They are Institutions, Infrastructure, Macroeconomic Stability, Health and Primary Education, Higher Education and Training, Goods Market Efficiency, Labour Market Efficiency, Financial Market Sophistication, Technological Readiness, Market Size, Business Sophistication, Innovation. According to overall index, Switzerland is the most competitive country in the world retaining leading position since 2008 after it outpaced United States which, in turn, worsened its position and moved from the first to the third place over the same period. While competitiveness is positively related to the wealth of the nation expressed through the GDP per capita, the relation between competitiveness and happiness seems to follow negative square pattern: middle level of competitiveness corresponds to the highest level of happiness. Along with the index characterizing country's economic competitiveness (the Global Competitiveness Index) there are indexes assessing country's performance in innovation sphere and its subdivisions (Innovation Union Scoreboard, Knowledge Economy Index, Global Innovation Index).
Every two years, the United Nations Department of Economic and Social Affairs (UNDESA) through its Division for Public Administration and Development Management (DPADM) publishes the United Nations E-Government Survey. The Survey provides a snapshot with relative rankings of e-government development of all Member States of the United Nations. By ranking the performance of countries on a relative scale, the Survey provides relevant information to support policy makers in shaping their e-government programmes for development. As a composite indicator, the e-government development index (EGDI) is used to measure the willingness and capacity of national administrations to use information and communication technologies to deliver public services. This measure of the index is useful for government officials, policy makers, researchers and representatives of civil society and the private sector to gain a deeper understanding of the comparative benchmarking of the relative position of a country in utilizing e-government for the delivery of inclusive, accountable and citizen-centric services. The EGDI is based on an expert assessment survey of the online presence of all 193 United Nations Member States, which assesses national websites and how e-government policies and strategies are applied in general and in specific sectors for delivery of essential services. The assessment rates the e-government performance of countries relative to one another as opposed to being an absolute measurement. Mathematically, the EGDI is a weighted average of three normalized scores on three most important dimensions of e-government, namely: scope and quality of online services (Online Service Index, OSI), development status of telecommunication infrastructure (Telecommunication Infrastructure Index, TII) and inherent human capital (Human Capital Index, HCI). For more information about the computation of the EGDI constituents and other methodology see the UN E-Government Survey page and methodological annexes. Source: UN E-Government ranking
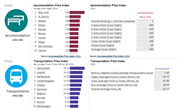
Make better educated travel decisions with the price index series presented in today's Viz of the Day. The figures highlight common travel-related expenditures, ranging from accommodation, transportation, and urban transit to beer and soccer, and may well help individual travelers to better gauge the relative cost of travel to their destinations of choice. See also: Transportation Price Index | Beer Price Index Source: GoEuro
The Democracy Index measures the state of democracy in 167 countries around the world. The index is based on 60 indicators grouped in five different categories: electoral process and pluralism, civil liberties, functioning of government, political participation, and political culture. In addition to a numeric score and a ranking, the index categorizes countries as one of four regime types: full democracies (8-9 overall index score), flawed democracies (6-7 overall score), hybrid regimes (4-6 overall score) and authoritarian regimes (less than 4). On this page you can analyze country-level statistics on democracy, using a new Knoema's bubble-tree visual gadget. Select the country of your interest on the map to see the details of its state of democracy, or choose the indicator from a bubble-tree to observe the world country rankings. Source: Sustainable Governance Indicators, Quality of Government Institute
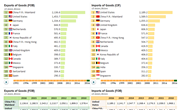
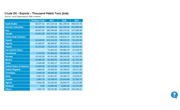
Over the last thirty years, the ranking of world exporters has significantly changed. Until 2000 the leading positions had been occupied by Germany and the United States. In 2010 China outpaced them, and till now China has taken the first place with a significant advantage, whereas the United States and Germany take the second and the third places accordingly. As regards the import, till 2016 the United States has taken the first position in the number of imported goods. Germany also imports a lot of goods that allows it to take the leading position. By 2005 China had also increased the value of imports, and since 2010 has taken the second place in the rating of imports. Exports Ranking shows the countries that take leading positions in the export of goods provided that the cost of transportation on board of airlines or cargoship is paid by the seller, that is called 'Freight on Board' or 'Free on Board"'(FOB). Imports Ranking demonstrates the value of transported goods subject to the seller arranges for the carriage of goods to a place of destination, for this, there is a term 'Cost, Insurance and Freight'(CIF). Access Data: IMF Direction of Trade Statistics (DOTS) Direction of Trade Statistics (DOTS) | Import By Partner Country | Export By Partner Country
The World Justice Project (WJP) Rule of Law Index® provides original, impartial data on how the rule of law is experienced by the general public in 102 countries around the globe. The WJP Rule of Law Index 2016® relies on over 100,000 household and 2,400 expert surveys to measure how the rule of law is experienced in practical, everyday situations by ordinary people around the world. Performance is assessed using 44 indicators across eight categories, each of which is scored and ranked globally and against regional and income peers: Constraints on Government Powers, Absence of Corruption, Open Government, Fundamental Rights, Order and Security, Regulatory Enforcement, Civil Justice, and Criminal Justice. The WJP Rule of Law Index is the most comprehensive index of its kind and the only to rely solely on primary data. The Index’s scores are built from the assessments of local residents (1,000 respondents per country) and local legal experts, ensuring that the findings reflect the conditions experienced by the population, including marginalized sectors of society. Source: The Rule of Law Index, 2016More about the Index: http://worldjusticeproject.org/rule-of-law-indexRead the methodology and view the surveys: http://worldjusticeproject.org/methodology
The Fragile States Index (FSI; formerly the Failed States Index) is an annual report published by the United States think-tank the Fund for Peace and the American magazine Foreign Policy since 2005. The list aims to assess states' vulnerability to conflict or collapse, ranking all sovereign states with membership in the United Nations where there is enough data available for analysis. Taiwan, the Palestinian territories, Northern Cyprus, Kosovo and Western Sahara are not ranked, despite being recognized as sovereign by one or more other nations. Ranking is based on the sum of scores for 12 indicators (see below). Each indicator is scored on a scale of 0 to 10, with 0 being the lowest intensity (most stable) and 10 being the highest intensity (least stable), creating a scale spanning 0−120. - Wikipedia
Innovation Union Scoreboard (IUS) Index assesses 27 European countries on how do they perform in innovation sphere and its subdivisions. By monitoring innovation progress across the EU27 member countries, as well as Iceland, Croatia, Norway, Serbia, Switzerland, Turkey and the Former Yugoslav Republic of Macedonia IUS attempts to build strong base to policy discussions and decisions at EU and national level. Measurement framework of IUS embraces in total 25 indicators serving as proxies for 8 innovation dimensions grouped into 3 pillars. Enablers pillar captures the main factors of innovation performance which are external to the company and cover three innovation dimensions: Human resources, Open, excellent and attractive research systems as well as Finance and support. Firm activities pillar captures the firm-level innovation efforts, grouped into the following innovation dimensions: Firm investments, Linkages & entrepreneurship and Intellectual assets. Outputs pillar covers the results of firms’ innovation efforts in two innovation dimensions: Innovators and Economic effects. The overall ranking within the EU remained relatively stable, with Switzerland at the top, followed by Sweden, Denmark, Finland and Germany. Over the period 2001-2015, long-term innovation performance has had a clear upward trend for the EU as a whole, with highest positive growth for Latvia, Malta and Bulgaria and the most negative growth for Romania. EU innovation performance has been increasing at an average annual rate of 0.6% between 2001 and 2015, but growth has not been equally strong across all dimensions and subdimensions. The largest growth is observed in Human resources (2.6%) and Research systems (1.7%). Growth in Intellectual assets and Innovators has been modest (1% and 0.5%, respectively). innovation performance in Finance and support demonstrates negative growth rate (-1.6%), caused by sharp decline in Venture capital investments (-5.7%). Moreover, negative growth occurs in Firm investments (-0.2%) and Linkages (-0.4%). The Innovation Union Scoreboard places Member States into the four country groups: Innovation leaders, Innovation followers, Moderate innovators and Modest innovators. The Innovation Leaders have balanced innovation systems with strengths in all dimensions, chased by the Innovations followers, the Moderate Innovators and the Modest Innovators. Performance differences, however, can be insignificant between the different performance groups, in particular for Human resources, Research systems, Innovators, and Economic effects between the Innovation Leaders and Innovations followers, for Firm investments between the Innovations followers and Moderate Innovators, and for Human resources and Intellectual assets between the Moderate and Modest innovators. IUS is one of the tools aimed at measuring of knowledge resources (or intellectual capital), which gain importance in the today's economy, across different countries. The other popular indices include Global Competitiveness Index, Knowledge Economy Index, Global Innovation Index.
World university rankings are lists of higher education institutions ordered using a combination of indicators. Some rankings rely mainly on research indicators, while others place a great deal of emphasis on opinion based surveys. Up to now, there has been no ranking measuring the quality of the learning environment as well as research without relying on surveys and university data submissions. The CWUR ranking measures the quality of education and training of students as well as the prestige of the faculty and the quality of their research could be constructed based solely on verifiable data. The results show that in addition to research performance, the quality of an institution’s alumni significantly affects its ranking. The indicators used to quantify these aspects are chosen to be robust against manipulation. The results of this study will be of interest to students, academics, university administrators, and government officials from around the world. (Nadim Mahassen, Center for World University Rankings, Jeddah, Saudi Arabia) (A quantitative approach to world university rankings) Source: CWUR World University Rankings, 2016
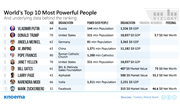
Every year Forbes publishes a list of nearly 80 people who make the world turn. The annual list is made up of presidents, prime ministers, CEOs, spiritual leaders, and some of the world's richest people. In today's viz, we share the most recent results and some of the underlying data behind the ranking. The information corresponds to the four dimensions Forbes uses to assess candidates:Power over people. Or, the ability to influence lives. This power dimension is inherent to the position of a president, ruling over a country with millions of inhabitants. Spiritual leaders have a similar inherent ability to influence the millions and even billions of believers of a given faith.Financial resources. This dimension includes candidates’ control over financial resources, such as a countries' GDP in the case of heads of state and corporate assets and revenues controlled by heads of corporations.Participation in multiple spheres. Exerting influence across multiple areas—geography, industry, and the like—further distinguishes candidates.Active use of resources. It is not enough to possess or control vast resources. To rank among the most powerful, Forbes examines how effectively an individual exercises those resources.
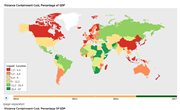
Escalating civil strife and the consequent refugee crisis have been among the key drivers in increasing the cost of global violence containment*, according to the 2016 Global Peace Index published by the global think-tank, the Institute for Economics and Peace. The total economic impact of violence last year reached US$14.3 trillion, or 13.4% of global GDP. That’s equivalent to the combined economies of Canada, France, Germany, Spain and the UK. Large increases in violence costs have occurred in deaths from internal conflict, IDP and refugee related costs, UN peacekeeping costs and GDP losses from conflict. Excluding North Korea, the ten countries with the largest violence containment expenditure as a percentage of GDP are in Latin America, Sub-Saharan Africa and MENA. Seven of these countries are involved in some form of civil conflict, which has become a major driver of violence containment expenditure in recent years. In absolute terms, the countries with the largest violence containment expenditure are the United States, China, Russia, India and Brazil. These countries account for 54 per cent of total violence containment expenditure while also accounting for 45 per cent of world GDP and 46 per cent of the world’s population. See also: Global Peace Index, 2017 * Violence containment is the economic activity related to the consequences or prevention of violence where the violence is directed against people or property. Source: Global Peace Index (GPI), 2017
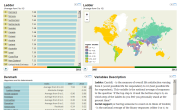
Today in the world there is a strong need for the policies that take into account the things that really matter for people, not just GDP per capita, which as a whole could be named happiness or life satisfaction. There exists rich evidence that these subjective evaluations of life have a significant impact on broad range of life outcomes, including material wealth, and for that reason they should be considered in determining strategic goals and policies. In order to facilitate this process, many initiatives from international organizations arise as an attempt to measure the level of happiness as well as to understand its main determinants. One of such initiatives, the results of which are presented on the dashboard below, is World Happiness Report 2013 (WHR) - the second study conducted by experts from Columbia University's Earth Institute on the basis of international survey by the Gallup World Poll in 160 countries which provides the sample of 1000 respondents per country through the 8-year time horizon. Since the word "happiness" can be interpreted at least in two ways: happiness in the sense of life evaluation (or life satisfaction) and happiness as an emotion, in the WHR there are several measures of happiness: Cantril ladder as a proxy for overall life evaluation (see the detailed descriptions of variables in the text box below), negative and positive affect as a proxies for recent good or bad feelings and happiness (yesterday) as a measure of emotional aspect of happiness. As it can be seen from bubble chart below there is strong positive relation between happiness as an emotion and happiness as life evaluation bringing an idea that they complement each other. However, the former is much more weekly explained by the main determinants of overall life satisfaction: having someone to count on in times of trouble (or social support), freedom to make life choices, perceptions of corruption, donation, generosity, GDP per capita and healthy life expectancy - finding that supports an idea that life evaluations are more closely related to life circumstances than the emotions are. Basing on the trends in the overall life evaluation between 2005-2007 and 2010-2012 it could be said that the world as a whole has become a bit happier during past five years even in spite of negative impact of the world financial crisis that, nevertheless, affected negatively the countries of Western Europe who faced a reduction in life satisfaction. Decline is also noted across the nations of Middle East and North Africa where political and social instability impose its negative affect. At the same time countries of Latin America and the Caribbean and Sub Saharan Africa experienced notable improvement in the quality of life through the period under consideration. Across Europe there are also different cross-currencies, thus, top-5 countries by overall happiness are from northern Europe, they are: Denmark, Norway, Switzerland, Netherlands and Sweden. To conclude, it is worth notice that judgment that happiness is determined mostly by material conditions and consumption is the spirit of modern times, which is not as true as, for example, Aristotle’s virtue, which is unfairly ignored. But it should be understood that, while concept of virtue ethics could be implemented into the strategy to increase happiness in community in practice, it is still very difficult to measure via traditional statistical tools, so the existing studies contribute significantly to the moving towards happiness oriented policy. See also the related dashboards: Quality of life in the EU | Wealth and happiness across the world | Happiness and life expectancy Sources: World Happiness Report 2013, April 2014 | Happy Planet Index | Human Development Report, 1980 - 2012
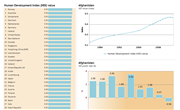
HUMAN DEVELOPEMENT INDEX (HDI) - is a composite index which includes health, education, income, livelihood security and other indicators. In other words, HDI is an indicator showig how successfull are achievenemts in three main fields of human development: healthy life, knowledge and decent standard of living. The chief aim of HDI is to provide nations with comprehensive measure of environment they provide for their people in terms of opportunites for personal fulfilment. The higher the HDI the better the conditions the country created for its citizens to live and work. The main idea of Human Development Index is as follows: people are the real value of any nation, and the richeness of human lifes is what every nation's government should worry about. Non-income HDI is a value of the HDI computed from the life expectancy and education indicators only and is calculated to provide an additional means of cross-country comparison and to order countries by achievements in the nonincome dimensions. Source: Human Development Report, 1980 - 2013
This is the second edition of the Global Slavery Index, the flagship report of the Walk Free Foundation. The Global Slavery Index estimates the number of people in modern slavery in 167 countries. It is a tool for citizens, non-government organizations, businesses and public officials to understand the size of the problem, existing responses and contributing factors, so they can build sound policies that will end modern slavery. The Global Slavery Index answers the following questions: What is the estimated prevalence of modern slavery country by country, and what is the absolute number by population? How are governments tackling modern slavery? What factors explain or predict the prevalence of modern slavery?
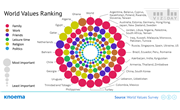
Researchers from the Vienna-based Institute for Comparative Survey Research surveyed 86,000 people from 60 countries worldwide during the period from 2010 to 2014 to gain insight into the relative importance of a select set of values. These values were: family, friends, leisure time, politics, religion, and work. Participants of the World Value Survey (WVS) were asked to define the importance of each value, with ranking options of very important, rather important, not very important and not at all important.The combined share of positive responses - very important and rather important - for a single country provides a useful measure to compare the relative importance of specific values among countries worldwide. These results are shown in the visualizations below. Test yourself Following are some of the interesting findings from the most recent survey responses:On average, values rank in the following order from most to least important: family, work, friends, leisure time, religion and politics.For all but five countries surveyed, family was the highest ranked value. Among countries where family was not ranked first, the Netherlands was the only country where respondents ranked friends as the highest priority, while Ghana was the only country where respondents ranked work above all else. The three remaining countries - the Arabic countries of Algeria, Egypt, and Qatar - religion was ranked most important. In other Middle-Eastern Arabic and Islamic countries, like Bahrain, Jordan, Iraq, Kuwait, Palestine, and Yemen, religion was ranked second only to family.In sharp contrast to family, politics was nearly universally the least important value among respondents from the 60 countries. Bahrain respondents placed the highest relative importance on politics among all countries, ranking politics above work and leisure but below family, religion, and friends.In three-fourths of the countries surveyed, work ranked more important than leisure. This contradicts economic theory, according to which leisure is a "good" while work is a “bad”. Increased consumption of leisure should increase an individual's level of satisfaction while work should decrease levels of utility. Interstate differences in the importance of work, however, did emerge. Respondents from high-income developed countries - where this economic theory originates - valued leisure more than work. At the same time, respondants from relatively poor countries - like Ghana, where the GDP per capita is 40 times less than that of the US - considered work to be of higher importance than leisure.Respondents from 60 percent of the countries ranked friends as more important than work. But, in only 53 percent of countries did friends outrank religion.Analysis of the WVS survey data also shows that following an increase in standards of living countries tend to move from traditional to secular-rational values and from survival to self-expression values.
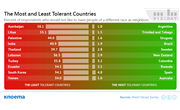
The World Values Survey (WVS) examines the changing values of societies and the impact of these changes on social and political life. The WVS is composed of nationally representative surveys conducted in almost 100 countries that represent almost 90 percent of the world’s population. Initiated in 1981, the WVS is the largest non-commercial, cross-national, time series investigation of human beliefs and values ever executed. The survey repository includes interviews with almost 400,000 respondents, covering all of the world’s major cultural zones. Among the dozens of questions that World Values asks is one about tolerance for other races. World Values asked respondents in more than 80 countries to identify the kinds of people they would not want as neighbors. Some respondents, picking from a list, chose "people of a different race." The more frequently that people in a given country gave that response, the less racially tolerant the society is rated. Quick Facts:Anglo and Latin countries most tolerant. People in the survey were most likely to embrace a racially diverse neighbor in the United Kingdom and its former colonies (Australia, Canada, New Zealand, and the US) and in Latin America.Wide variation across Europe. Immigration and national identity are pervasive, sensitive issues in much of Europe, where the racial make-up is changing.Racial tolerance low in diverse Asian countries. Nations such as the Philippines, where many racial groups often jockey for influence and have complicated histories with one another, showed more skepticism of diversity.Pakistan, remarkably tolerant, an outlier. Although Pakistan has a number of factors that coincide with racial intolerance – sectarian violence, its location in the least-tolerant region of the world, and low economic and human development indices – only 15 percent of Pakistanis objected to a neighbor of a different race.
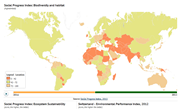
Date of Event: 20-21 February 2016 Event Holder: IISD-Forest Description: The Stakeholder Days, organized prior to the fourth Plenary Session of the Intergovernmental Platform on Biodiversity and Ecosystem Services (IPBES-4), aim to provide observers and stakeholders of IPBES with updates about the IPBES process and their engagement in IPBES-4, and to provide an opportunity to prepare joint positions on key issues.
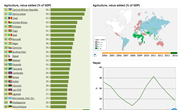
Source: World Development Indicators, August 2015EconomyCrimeDemographicsGDP, current prices USDHomicide RateTotal Population ForecastGDP, PPP current intern. $HomicidesPopulation Growth Rate ForecastGDP per capita, current prices USDPercentage of homicides by firearmPopulation Density ForecastGDP per capita, PPP current intern. $Number of homicides by firearmMedian Age of the Population ForecastForeign Direct InvestmentHomicide by firearm rate Total populationTotal External Debt, USDAssault, ratePopulation Growth RateShare of AgricultureKidnapping, ratePopulation DensityShare of ManufacturingRobbery, rateMedian Age of PopulationShare of ServicesRape, rateMortality rate, under-5Unemployment rateBurglary,rateMortality rate, neonatalConsumer Price IndexTheft, Private Cars, RateMortality rate, infantGoverment Debt, % of GDPTheft, Motor Vehicle, RateDeath rateCurrent Account Balance, USDBurglary/housebreaking ,RateLife expectancy at birthCurrent Account Balance, % of GDP Fertility RateEmployment in agriculture EducationAgricultureEnergyEnrolment Ratio. Pre-primary EducationCrops Production. QuantityTotal Biofuels ProductionEnrolment Ratio. Primary EducationCrops Production. Area HarvestedPrimary Energy ConsumptionEnrolment Ratio. Secondary EducationCrops Production. YieldWind Electricity Net GenerationEnrolment Ratio. Tertiary EducationLive Stock Production. StocksSolar, Tide and Wave ElectricityPublic Expenditures on Education Live Stock Production. QuantityCrude Oil Proved ReservesLiteracy Rate. Adult (15+)Trade. Import QuantityProved Reserves of Natural GasSchool life expectancy. TertiaryTrade. Export quantityProduction of Crude OilOutbound Mobility Ratio (%). TertiaryFood Supply. Quantity (kg/capita/yr)Gross Natural Gas ProductionAcademic Ranking of World UniversitiesFood Supply. Energy (kcal/capita/day)Total Primary Coal Production Total Electricity Net Generation Total Recoverable Coal HealthGovernancePovertyHealth Expenditure Per CapitaCountry Policy and Institutional AssessmentPoverty ratio at $1.25 a dayTotal Health ExpendituresTransformation IndexPoverty ratio at $2 a dayOut-of-pocket health expendituresBetter Life IndexPoverty ratio at national poverty linePrevalence of HIVGlobal Slavery IndexPoverty ratio at rural poverty lineDepth of the food deficitDemocracy IndexPoverty ratio at urban poverty linePrevalence of undernourishmentQuality of Government Institute StandardGINI indexGlobal Snakebits StatisticsThe Rule of Law IndexIncome share held by lowest 10%Immunization, DPTWorld Press Freedom Index, 2014Income share held by highest 10% BusinessCorruptionEnvironmentGlobal Dynamism Index (GDI)Corruption Perception IndexEnvironmental Performance IndexIndex of Economic FreedomFreedom House Nations in TransitGlobal Green Economy IndexSurvey of Mining CompaniesGlobal Business Bribery Risk Index Enabling Trade Index World Bank Doing Business CompetitivenessTransportationProsperityGlobal manufacturing competitiveness indexLogistics Perfomance IndexLegatum Prosperity Index RankGlobal Competitiveness IndexTransportation Price IndexLegatum Prosperity Index Indicators StatisticsFreedomPensionsOpen Data BarometerFreedom in the WorldGlobal AgeWatch IndexMap Data. Open Data Barometer DemocracyFood SecurityResearch and DevelopmentGlobal Democracy RankingGlobal Hunger IndexGlobal Innovation Index Human DevelopmentProperty RightsKnowledgeHuman Development ReportInternational Property Rights IndexKnowledge Economy Index TelecommunicationOcean Exchange RatesNetworked Readiness IndexOcean Health IndexThe Economist Big Mac Index Happiness World Happiness Index
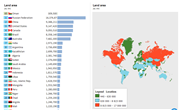
Source: World Development Indicators (WDI), November 2014
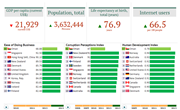
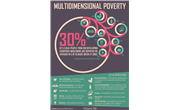
Multidimensional Poverty Index (MPI) complements standard income poverty indicators (which define poverty as percent of population living at 1.25, 2, 2.5 etc. dollars a day) by taking into account deprivation aspect of poverty. Thus, for many people being poor means not only lack of money but also limited access to education, nutrition, sanitation, water and so on. MPI concept embraces this idea by defining the poor as those who are simultaneously deprived in several of these things. More specifically, MPI is based on 10 indicators which are grouped into three categories: health, education and living standards (following the Human Development Index (HDI) methodology). Indicators represent a set of deprivations with weights, so that weights across dimensions are equal and weights for each indicator within dimensions are equal. If an individual suffers from one of the deprivations (e.g. no household member has completed five years of schooling) then he gets "1" multiplied by weight of this indicator (continuing our example it would be 1*1/6). Then values of all 10 indicators multiplied by their weights are summed to get the individual deprivation score - % of 10 deprivations which the individual faces. MPI poor are defined as those who have more than one third of 10 deprivations. The share of such people in the total country's population is named "Headcount ratio: population in multidimensional poverty" while the average value of individual deprivation scores of MPI poor people gives indicator "Intensity of deprivation among the poor". The overall MPI score for the country is the result of multiplying one by another. So, the index takes into account both poverty headcount and poverty severity. Except the poor MPI also considers the following categories: vulnerable to poverty (those who experience intensity of deprivation between 20 and 32.9%), in severe poverty (with deprivation intensity higher than 50%) and destitute or "the poorest of the poor" - those who live in even more extreme conditions than the poor do. In terms of measuring destitution MPI uses absolutely the same methodology but employs more rigid criteria of deprivations, for example, not "No household member has completed five years of schooling" but "No household member has completed at least one year of schooling". The list of deprivations, corresponding criteria used to define MPI poor (and MPI destitute in brackets) and indicators' weights is presented below: Years of Schooling - No household member has completed five years (at least one year) of schooling. 1/6; Child School Attendance - Any school-aged child is (no school-aged children are) not attending school up to class 8 (6). 1/6; Child Mortality - Any child has (2 or more children have) died in the family. 1/6; Nutrition - Any adult or child for whom there is nutritional information is malnourished (severely malnourished: BMI<17kg/m2 for adults and -3 standard deviations from the median for children). 1/6; Electricity - The household has no electricity (the same). 1/18; Improved Sanitation - The household’s sanitation facility is not improved (according to MDG guidelines), or it is improved but shared with other households (there is no sanitation facility: open defecation). 1/18; Improved Drinking Water - The household does not have access to improved drinking water (according to MDG guidelines) or safe drinking water is more than a 30-minute (45-minute) walk from home, roundtrip. 1/18; Flooring - The household has a dirt, sand or dung floor (the same). 1/18; Cooking Fuel - The household cooks with dung, wood or charcoal (with dung or wood: coal/lignite/charcoal are now non-deprived). 1/18; Assets ownership - The household does not own more than one radio, TV, telephone, bike, motorbike or refrigerator (has no assets) and does not own a car or truck. 1/18. Multidimensional Poverty Index by area of residence: total | urban | rural Take a look at static infographics
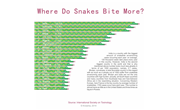
India is a country with the biggest amount of snakebite envenoming cases occurring each year: on average, 120 thousand cases take place every year in this country. However, India is the second biggest country in the world and that is why mentioned above number looks much less ghastly in terms of per 1000 population, namely, 0.1 cases. Bhutan, conversely, is less favorable country in this regard with as much as 4 people out of 1000 suffer from snakebite envenoming each year. Bhutan and India are not the only countries with high burden: actually, all South Asian countries and many countries from Southeast Asia and Sub-Saharan Africa are in the resembling situation. Concerning Western Europe, here France is the top country by average number of snakebites: 1700 cases occur here each year. This number is almost twice as little as in the United States and three times as big as in Russia.
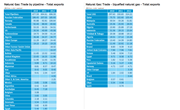
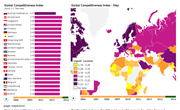
The Global Competitiveness Report 2014-2015 assesses the competitiveness landscape of 144 economies, providing insight into the drivers of their productivity and prosperity. The report remains the most comprehensive assessment of national competitiveness worldwide, providing a platform for dialogue between government, business and civil society about the actions required to improve economic prosperity. Competitiveness is defined as the set of institutions, policies and factors that determine the level of productivity of a country. The level of productivity, in turn, sets the level of prosperity that can be earned by an economy. The different aspects of competitiveness are captured in 12 pillars, which compose the Global Competitiveness Index. This 35th edition emphasizes innovation and skills as the key drivers of economic growth. While these increasingly influence competitiveness and the global economy tentatively recovers from the economic crisis, significant risks remain, resulting from a strained geopolitical situation, rising income inequality and the potential tightening of financial conditions. It is therefore crucial to address these structural challenges to ensure more sustainable and inclusive growth. More than ever, cooperative leadership among business, government and civil society is needed to re-establish sustainable growth and raise living standards throughout the world. Source: The Global Competitiveness Report 2014-2015
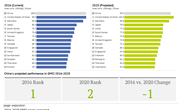
Nations worldwide have increased their focus on developing advanced manufacturing capabilities through investment in high-tech infrastructure and education, spurring rapid evolution in the nature of global manufacturing, according to the latest global manufacturing study from Deloitte Global and the Council on Competitiveness. Technology-intensive sectors now dominate the global manufacturing landscape in most advanced economies and appear to offer a strong path to achieve or sustain manufacturing competitiveness. In the 2016 GMCI, CEO survey respondents were asked to rank nations in terms of current and future manufacturing competitiveness. Report highlights include:China is the most competitive manufacturing nation…for now. According to the latest report, China remains the most competitive manufacturing nation, but based on the perspectives of global executives, the country will slip to second position behind the US during the next five years.The United States is expected to take over the number one position while Germany will hold firm at number three. The US improved its ranking between the 2010 and 2013 surveys and again between the 2013 and 2016 surveys. Executives anticipate Germany will remain in third position through the application of advanced and sophisticated product and process technologies and materials, among other factors. Source: 2016 Global Manufacturing Competitiveness Index
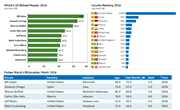
According to the 2016 Forbes World's Billionaires List, the total number of billionaires worldwide expanded to 1,810. The aggregate net worth of the list's members exceeded $6 trillion, while the average net worth was $3.6 billion. Source: Forbes World's Billionaires
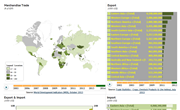
Date of Event: 14-18 March 2016 Event Holder: IISD Description: The 14th session of the UN Conference on Trade and Development (UNCTAD XIV) will bring together Heads of State and Government, ministers and leaders from the private sector, civil society and academia to consider how to implement the post-2015 development agenda in relation to global trade and economic development issues. The meeting will decide on UNCTAD's programme of work, and will include ministerial debates, high-level round tables, thematic events, a World Investment Forum and a Civil Society Forum. The Conference will also consider the most appropriate means of delivering on the post-2015 development agenda. The UNCTAD global conference takes place once every four years. UNCTAD is a subsidiary organ of the UN General Assembly (UNGA).
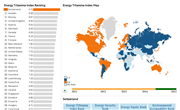
The Energy Trilemma Index ranks countries in terms of their likely ability to provide sustainable energy policies through the three dimensions of the energy trilemma:Energy security: the effective management of primary energy supply from domestic and external sources, the reliability of energy infrastructure, and the ability of participating energy companies to meet current and future demand.Energy equity: the accessibility and affordability of energy supply across the population.Environmental sustainability: the achievement of supply and demand-side energy efficiencies and the development of energy supply from renewable and other low-carbon sources. Switzerland maintains the top spot in the Index for yet another year and exhibits strong, balanced performance, achieving top-10 rankings on all three dimensions. Energy security is Switzerland's least strong dimension, as the country imports around half of the energy it uses. Energy equity is high, however, and Switzerland continues to be the best in the world at limiting its impact on the environment, with low levels of pollution and an ultra-low emission energy infrastructure, which utilizes fossil-fueled power plants for only 1 percent of electricity generation. Contextual performance - which covers the broader circumstances of energy performance including societal, political and economic strength and stability - remains among the best in the world. Source: 2015 Energy Trilemma Index
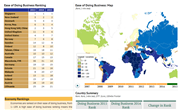
Doing Business 2015: Going Beyond Efficiency, a World Bank Group flagship publication, is the 12th in a series of annual reports measuring the regulations that enhance business activity and those that constrain it. Doing Business presents quantitative indicators on business regulations and the protection of property rights that can be compared across 189 economies—from Afghanistan to Zimbabwe—and over time. Doing Business measures regulations affecting 11 areas of the life of a business. Ten of these areas are included in this year’s ranking on the ease of doing business: starting a business, dealing with construction permits, getting electricity, registering property, getting credit, protecting minority investors, paying taxes, trading across borders, enforcing contracts and resolving insolvency. Doing Business also measures labor market regulation, which is not included in this year’s ranking. Data in Doing Business 2015 are current as of June 1, 2014. The indicators are used to analyze economic outcomes and identify what reforms of business regulation have worked, where and why. This year’s report introduces a notable expansion of several indicator sets and a change in the calculation of rankings. Source: World Bank Doing Business 2015: Going Beyond Efficiency
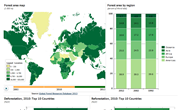
Date of Event: 25-27 April 2016 Event Holder: IISD-Forest Description: The second meeting of the Open-ended Intergovernmental Ad Hoc Expert Group (AHEG) of the UN Forum on Forests (UNFF) is expected to develop proposals on a range of legal and financing options with regard to forests.
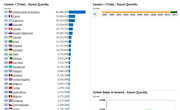
Source: Trade Statistics - Crops, Live Stock Products & Live Animal, 2013EconomyCrimeDemographicsGDP, current prices USDHomicide RateTotal Population ForecastGDP, PPP current intern. $HomicidesPopulation Growth Rate ForecastGDP per capita, current prices USDPercentage of homicides by firearmPopulation Density ForecastGDP per capita, PPP current intern. $Number of homicides by firearmMedian Age of the Population ForecastForeign Direct InvestmentHomicide by firearm rate Total populationTotal External Debt, USDAssault, ratePopulation Growth RateShare of AgricultureKidnapping, ratePopulation DensityShare of ManufacturingRobbery, rateMedian Age of PopulationShare of ServicesRape, rateMortality rate, under-5Unemployment rateBurglary,rateMortality rate, neonatalConsumer Price IndexTheft, Private Cars, RateMortality rate, infantGoverment Debt, % of GDPTheft, Motor Vehicle, RateDeath rateCurrent Account Balance, USDBurglary/housebreaking ,RateLife expectancy at birthCurrent Account Balance, % of GDP Fertility RateEmployment in agriculture EducationAgricultureEnergyEnrolment Ratio. Pre-primary EducationCrops Production. QuantityTotal Biofuels ProductionEnrolment Ratio. Primary EducationCrops Production. Area HarvestedPrimary Energy ConsumptionEnrolment Ratio. Secondary EducationCrops Production. YieldWind Electricity Net GenerationEnrolment Ratio. Tertiary EducationLive Stock Production. StocksSolar, Tide and Wave ElectricityPublic Expenditures on Education Live Stock Production. QuantityCrude Oil Proved ReservesLiteracy Rate. Adult (15+)Trade. Import QuantityProved Reserves of Natural GasSchool life expectancy. TertiaryTrade. Export quantityProduction of Crude OilOutbound Mobility Ratio (%). TertiaryFood Supply. Quantity (kg/capita/yr)Gross Natural Gas ProductionAcademic Ranking of World UniversitiesFood Supply. Energy (kcal/capita/day)Total Primary Coal Production Total Electricity Net Generation Total Recoverable Coal HealthGovernancePovertyHealth Expenditure Per CapitaCountry Policy and Institutional AssessmentPoverty ratio at $1.25 a dayTotal Health ExpendituresTransformation IndexPoverty ratio at $2 a dayOut-of-pocket health expendituresBetter Life IndexPoverty ratio at national poverty linePrevalence of HIVGlobal Slavery IndexPoverty ratio at rural poverty lineDepth of the food deficitDemocracy IndexPoverty ratio at urban poverty linePrevalence of undernourishmentQuality of Government Institute StandardGINI indexGlobal Snakebits StatisticsThe Rule of Law IndexIncome share held by lowest 10%Immunization, DPTWorld Press Freedom Index, 2014Income share held by highest 10% BusinessCorruptionEnvironmentGlobal Dynamism Index (GDI)Corruption Perception IndexEnvironmental Performance IndexIndex of Economic FreedomFreedom House Nations in TransitGlobal Green Economy IndexSurvey of Mining CompaniesGlobal Business Bribery Risk Index Enabling Trade Index World Bank Doing Business CompetitivenessTransportationProsperityGlobal manufacturing competitiveness indexLogistics Perfomance IndexLegatum Prosperity Index RankGlobal Competitiveness IndexTransportation Price IndexLegatum Prosperity Index Indicators StatisticsFreedomPensionsOpen Data BarometerFreedom in the WorldGlobal AgeWatch IndexMap Data. Open Data Barometer DemocracyFood SecurityResearch and DevelopmentGlobal Democracy RankingGlobal Hunger IndexGlobal Innovation Index Human DevelopmentProperty RightsKnowledgeHuman Development ReportInternational Property Rights IndexKnowledge Economy Index TelecommunicationOcean Exchange RatesNetworked Readiness IndexOcean Health IndexThe Economist Big Mac Index Happiness World Happiness Index
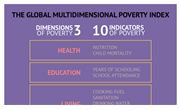
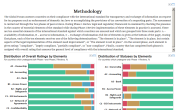
In the last five years immense progress has been made all around the world in the field of enhancing tax transparency. Today it can be said that era of bank secrecy for tax purposes is over due to implementation of international standards of tax transparency and exchange of information on request (EIOR) by many countries that helps successful tackling of international tax evasion. Global Forum on Transparency and Exchange of Information for Tax Purposes is leading the way in this process by promoting rapid implementation of high international standards of transparency and ensuring that these standards are in place around the world through the monitoring, review and assessment activities. The results of these activities are presented on the page below.
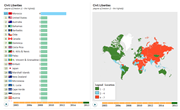
Freedom in the World, Freedom House’s flagship publication, is the standard-setting comparative assessment of global political rights and civil liberties. Published annually since 1972, the survey ratings and narrative reports on 193 countries and 15 related and disputed territories are used by policymakers, the media, international corporations, civic activists, and human rights defenders to monitor trends in democracy and track improvements and setbacks in freedom worldwide. Source: Freedom in the World - Comparative and Historical Data
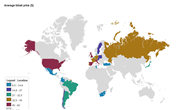
Prices of Important Travelling Items in Cities around the World
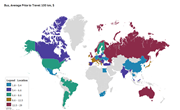
Prices of Important Travelling Items in Cities around the World
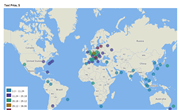
Prices of Important Travelling Items in Cities around the World
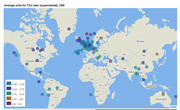
Prices of Important Travelling Items in Cities around the World

Prices of Important Travelling Items in Cities around the World
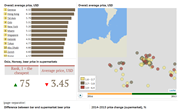
The cheapest city to drink a beer is Krakow, Poland, according to the results of 2015 GoEuro Beer Price Index. The average price of a 33cl bottle of beer in this Polish city came in at only $1.66. In contrast, you'll likely not be surprised to learn that Geneva, Switzerland, has become the most expensive city worldwide to grab a beer, with an average beer price of $6.32. You can avoid a costly beer in Geneva if you shop for your beer in local supermarkets, where prices are roughly one sixth of those charged in bars, a trend observed across all the most expensive cities included in the survey. All in all, 2015 results show a large difference in beer price across countries as well as significant changes from 2014. Beer drinkers in Oslo, Norway, should be pleased. Ranked the most expensive city in 2014, in 2015 it fell to fourth most expensive, benefiting from a decrease in the price of supermarket beer and a relative advantage against countries affected by currency appreciations and devaluations. See also: 2014 Beer Price Index
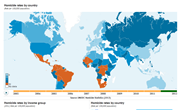
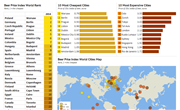
Polish capital Warsaw is the most affordable city among 40 countries worldwide to drink a bottle of beer according to the study conducted by popular tourist portal GoEuro. 33cl bottle of beer in this city costs in average 0.79 euros. Next 4 the cheapest countries are Germany, Czech Republic, Portugal and Ireland. In bulk, European countries are favorable to have a quick one with the exception of Sweden, United Kingdom, Switzerland and Norway. The latter, in fact, is the most expensive country with the price for a bottle of beer in its capital Oslo constituting 3.55 euros which is 4 times as much as beer price in Poland. See also GoEuro Transportation Price Index.
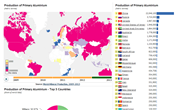
In today's Viz of the Day we highlight global trends in mineral production. The visualizations include production figures for more than 70 mineral commodities in 175 countries, covering a five-year period from 2009 to 2013. Here are a few highlights:According to 2013 data compiled by the British Geological Survey in the World Mineral Production 2009-13, production of bauxite experienced the largest annual increase, growing by nearly 16 percent during the period from 2012-2013. Mine production of tin - up approximately 14 percent compared to 2012 - occupied second place in terms of production growth, followed by chromium ores and concentrates, which increased about 12 percent from 2012 to 2013. Zirconium, on the other hand, showed the largest decrease in global production, falling 17 percent from 2012 to 2013.The data also reveals China's dominate production position across a number of minerals. China produced about 22 million metric tonnes of primary aluminium in 2013, or 46.7 percent of global primary aluminum production. It was also the largest producer of crude steel and iron ore (48.4 percent and 45.9 percent of global production, respectively) and remained practically the only mined antimony producer in the world. Antimony is reportedly used as an alloying material for lead and tin for use in products ranging from bullets to bearings, a component in lead-acid batteries, an additive in fire retardants for commercial and domestic applications, and in emerging material components of microelectronics. Browse data by country or by mineral to discover more about global mineral production. By Country | By Mineral
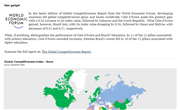
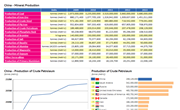
In today's Viz of the Day we highlight global trends in mineral production. The visualizations include production figures for more than 70 mineral commodities in 175 countries, covering a five-year period from 2009 to 2013. Here are a few highlights:According to 2013 data compiled by the British Geological Survey in the World Mineral Production 2009-13, production of bauxite experienced the largest annual increase, growing by nearly 16 percent during the period from 2012-2013. Mine production of tin - up approximately 14 percent compared to 2012 - occupied second place in terms of production growth, followed by chromium ores and concentrates, which increased about 12 percent from 2012 to 2013. Zirconium, on the other hand, showed the largest decrease in global production, falling 17 percent from 2012 to 2013.The data also reveals China's dominate production position across a number of minerals. China produced about 22 million metric tonnes of primary aluminium in 2013, or 46.7 percent of global primary aluminum production. It was also the largest producer of crude steel and iron ore (48.4 percent and 45.9 percent of global production, respectively) and remained practically the only mined antimony producer in the world. Antimony is reportedly used as an alloying material for lead and tin for use in products ranging from bullets to bearings, a component in lead-acid batteries, an additive in fire retardants for commercial and domestic applications, and in emerging material components of microelectronics. Browse data by country or by mineral to discover more about global mineral production. By Country | By Mineral
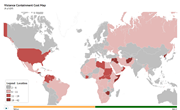
Date of Event: 23-24 May 2016 Event Holder: IISD Description: The UN Office for the Coordination of Humanitarian Affairs (OCHA) is organising the summit, which aims to set a new agenda for global humanitarian action, focusing on humanitarian effectiveness, reducing vulnerability and managing risk, transformation through innovation, and serving the needs of people in conflict. The summit, the first UN conference of its kind, will bring together the humanitarian community with other actors from the development, peace-building and peacekeeping spheres to work toward a coherent approach in the way humanitarian aid is delivered. Heads of State and Government, and representatives of civil society, the private sector, crisis-affected communities and multilateral organisations will attend the Summit. Preparations are taking place via one global and seven regional meetings, online consultations, and a September 2015 thematic meeting in Berlin, Germany. UN Secretary-General Ban Ki-moon is establishing a High-level Panel on Humanitarian Financing to provide recommendations that will help to frame the Summit discussions.
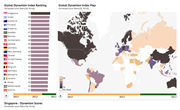
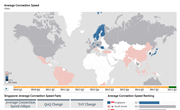
In today's Viz of the Day we present a unique interactive visualization designed on the basis of Akamai Q2 2015 State of the Internet Report, which shows the main trends in the average and peak internet connection speeds across various countries during the 5-year period from Q1 2010 to Q2 2015. The dashboard clearly shows that the average connection speed has increased significantly during the previous five years in all countries, reaching a world average of 5.1 megabits per second (Mbps) in Q2 2015. South Korea leads the ranking with average connection speed of 23.1 Mbps. That is almost 36 percent higher than in Hong Kong, which is ranked second, and more than twice as high as the United States. Peak connection speed around the world also demonstrated considerable growth. Singapore is ranked first by Peak Connection Speed at 108.3 Mbps, which is 17.3 percent higher than in the previous quarter and almost 88 percent higher compared to Q1 2014 data.
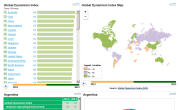
The Grant Thornton Global Dynamism Index (GDI) ranks 60 leading economies on their dynamism in five key areas – business operating environment, economics & growth, science & technology, labour & human capital and financing environment. The GDI analyses 22 indicators across these five categories to assess the dynamism of business growth environments around the world, where dynamism refers to the changes in an economy over the past 12 months which are likely to lead to a faster future rate of growth. Source : http://knoema.com/data/index/GDI2014
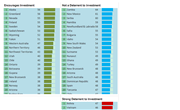
The Policy Potential Index (PPI) is a composite index, measuring the overall policy attractiveness of the 96 jurisdictions in the survey. The index is composed of survey responses to 15 policy factors that affect investment decisions. The PPI is normalized to a maximum score of 100. Finland had the highest PPI score of 95.5. Along with Finland, the top 10 ranked jurisdictions are Sweden, Alberta, New Brunswick, Wyoming, Ireland, Nevada, Yukon, Utah, and Norway. All were in the top 10 last year except for Utah and Norway. Yukon was the first Canadian territory to make the top 10 in 2011/2012. Both Quebec and Saskatchewan fell out of the top 10 in 2012/2013. Chile, which had previously been the only jurisdiction outside North America consistently in the top 10 over the life of the survey, has continued to fall in the rankings to 23rd place in this survey. Norway rose to 10th in the rankings from 24th in 2011/2012, and Sweden and Finland have now been in the top 10 for the last three and four years, respectively. Source: FRASER
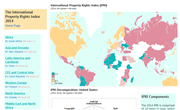
The International Property Rights Index (IPRI) is the flagship publication of the Property Rights Alliance (PRA), which is committed to promoting property rights around the world. The IPRI is an annual research that aims to evaluate the strength of both physical and intellectual property rights in different countries around the globe. The IPRI scores and ranks each country based on 10 factors reflecting the state of its Legal and Political Environment (LP), Physical Property Rights (PPR), and Intellectual Property Rights (IPR). The Legal and Political Environment (LP) component provides an insight into the impact of political stability and rule of law in a given country. Consequently, the measures used for the LP are broad in scope. This component has a significant impact on the development and protection of physical and intellectual property rights. The other two components of the index – Physical and Intellectual Property Rights (PPR and IPR) – reflect two forms of property rights, both of which are crucial to the economic development of a country. The items included in these two categories account for both de jure rights and de facto outcomes of the countries considered. This set of interactive visualizations captures the key findings from The International Property Rights Index 2014. Explore regional profiles and overall rankings smartly designed for you via Knoema's unique platform. Dataset: The International Property Rights Index 2014 Original Source: http://internationalpropertyrightsindex.org/
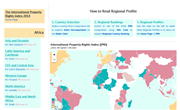
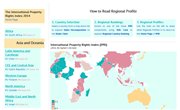
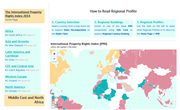
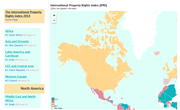
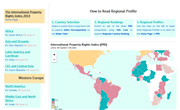
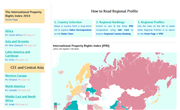
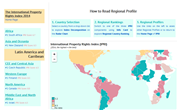
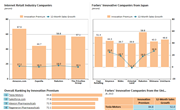
Most innovation rankings are popularity contests based on past performance or editorial whims. We set out to create something very different with the World’s Most Innovative Companies list, using the wisdom of the crowd. Our method relies on investors’ ability to identify firms they expect to be innovative now and in the future. Companies are ranked by their innovation premium: the difference between their market capitalization and a net present value of cash flows from existing businesses (based on a proprietary formula from Credit Suisse HOLT). The difference between them is the bonus given by equity investors on the educated hunch that the company will continue to come up with profitable new growth. To be included, firms need seven years of public financial data and $10 billion in market cap. (Facebook FB +1.28%, for example, would be in the top ten if we used only 2012 data.) We include only industries that are known to invest in innovation., excluding industries that have no measurable investment in R&D, so banks don’t make the list. Nor do energy and mining firms, whose market value is tied more to commodity prices than it is to innovation. Big caveat: Our picks do not correlate with subsequent investor returns. To the extent that today’s share price embeds high-growth expectations, one might even anticipate returns to investors to be low, as these expectations may be difficult to meet. -- Forbes In today's Viz of the Day, we provide a special snapshot of the performance of US companies on Forbes' Innovative Companies list; these companies make up nearly have of the top 100 for 2015. Source of description: How We Rank The World's Most Innovative Companies, 2015 Source of data: Forbes - The World's Most Innovative Companies, 2015
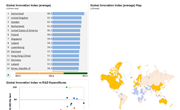
The Global Innovation Index (GII) recognizes the key role of innovation as a driver of economic growth and prosperity and acknowledges the need for a broad horizontal vision of innovation that is applicable to both developed and emerging economies, with the inclusion of indicators that go beyond the traditional measures of innovation (such as the level of research and development in a given country). The GII has evolved into a valuable benchmarking tool to facilitate public-private dialogue, whereby policymakers, business leaders and other stakeholders can evaluate progress on a continual basis. The GII relies on two sub-indices, the Innovation Input Sub-Index and the Innovation Output Sub-Index, each built around pillars. Five input pillars capture elements of the national economy that enable innovative activities: Institutions, Human capital and research, Infrastructure, Market sophistication, and Business sophistication. Two output pillars capture actual evidence of innovation outputs: Knowledge and technology outputs and Creative outputs. Source: Global Innovation Index 2014
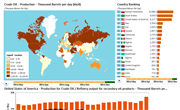
The Joint Organisations Data Initiative (JODI) is one of the most comprehensive sources of oil industry statistics in the world. The database contains monthly updates for production, demand, refinery intake and output, imports, exports, closing stock levels for crude oil and various oil products for more than 90 participating countries. With Knoema's interactive flexibility you can easily explore the complex JODI dataset. Select your own indicator and unit of measure at the top-left of the map to observe instantly shifts in the global production history. Or, select a country on the map along with your indicator of choice to dive deeper into country-level data as the graphs at the bottom automatically refresh. Extract any of the graphics to develop your own presentation or to dive still deeper into the data. Data source: JODI Oil dataset, February 2015
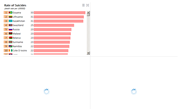
Over 800,000 people die due to suicide every year and there are many more who attempt suicide. Hence, many millions of people are affected or experience suicide bereavement every year. There is one death by suicide in the world every 40 seconds. Suicide is the 3rd leading cause of death in the world for those aged 15-44 years. Source : http://knoema.com/WLDSU2015/suicide-statistics-2013
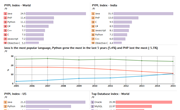
PYPL Index : The PYPL PopularitY of Programming Language Index is created by analyzing how often language tutorials are searched on Google. According to PYPL Index, Java is the most widely searched programming language in the world. Java has a 24.3 percent developer share in March 2015. Searches of Java has went down by 0.6 percent. PHP remains in second position, but some distance behind, with a share of 11.4 percent. Gap between Java and PHP is more wide in India. In India, Java Shares 31.5 percent compare to 13.0 percent of PHP. In US, PHP is at 8th place. PHP is now closely followed by Python (10.7), Which is second most searched language in US behind Java. Python gains 1.1 percent in worldwide searches since March 2014. In US, margin between Java and Python is 5.3 percent, while this figure is 12.9 in worldwide trends. Other popular languages are C#, C++, C, Javascript and Objective-C. Swift, the new language introduced by Apple, is ranked 11th by PYPL. Popularity of Swift is increased by 3% this year. C and R languages has also became more popular. Swift and JavaScript is declared as language of the year 2014 by PYPL and TIOBE index respectively. Source : http://knoema.com/ITPYPLC2015/pypl-popularity-of-programming-language-index
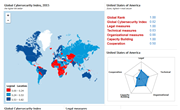
Technology is ever evolving and new cyber threats continue to be devised. In embracing technology progress, cybersecurity must form an integral and indivisible part of the process. Unfortunately, cybersecurity is not yet at the core of many national and industrial technology strategies. Countries need to be aware of their current capability level in cybersecurity and at the same time identify areas where cybersecurity needs to be enhanced. The Global Cybersecurity Index (GCI) is a measure of each nation state’s level of cybersecurity development. The GCI aims at providing the right motivation to countries to intensify their efforts in cybersecurity. The ultimate goal is to help foster a global culture of cybersecurity and its integration at the core of information and communication technologies. Source: Global Cybersecurity Index, 2015
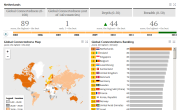
DHL released the third edition of its Global Connectedness Index (GCI), a detailed analysis of the state of globalization around the world. The latest report, authored by internationally acclaimed globalization expert Professor Pankaj Ghemawat together with Steven A. Altman, shows that global connectedness, measured by cross-border flows of trade, capital, information and people, has recovered most of its losses incurred during the financial crisis. Especially the depth of international interactions – the proportion of interactions that cross national borders – gained momentum in 2013 after its recovery had stalled in the previous year. Nonetheless, trade depth, as a distinct dimension of globalization, continues to stagnate and the overall level of global connectedness remains quite limited, implying that there could be gains of trillions of US dollars if boosted in future years. The DHL Global Connectedness Index aims to provide the most comprehensive and timely account of the world’s global connectedness, backed up by regional and country level analysis covering 140 countries that encompass 99% of the world’s GDP and 95% of its population. It focuses on 12 types of trade, capital, information, and people flows (or stocks cumulated from past flows) and is generated based entirely on hard data to separate the facts about global connectedness from fiction or “globaloney.” Depth measures countries’ international flows relative to the size of their domestic economies. While all the established globalization indexes devote some attention to depth, the DHL Global Connectedness Index is the only one to register the steep drop-off in trade and capital flows that accompanied the global financial crisis. In addition to depth, the DHL Global Connectedness Index also looks—unlike other globalization indexes—at breadth as well as several other measures of the distribution of international interactions. Breadth measures how closely a country’s distribution of international flows across its partner countries matches the global distribution of the same type of flows. Source of data: DHL, Global Connectedness Index
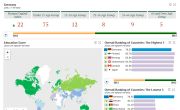
Talent, not capital, will be the key factor linking innovation, competitiveness and growth in the 21st century, and we must each understand better the global talent value chain. Better data and metrics are critical to this understanding. The Human Capital Index quantifies how countries are developing and deploying their human capital and tracks progress over time. This Report provides comprehensive information on the talent base in each country, including information on education levels of the employed, unemployed and the inactive members of the population as well as the specific qualifications of the latest entrants to the workforce. The Human Capital Index measures countries’ ability to maximize and leverage their human capital endowment. The index assesses Learning and Employment outcomes across 5 distinct age groups, on a scale from 0 (worst) to 100 (best), and assesses 124 economies. To estimare the index score 4 pillars are took into account: a) Education (Access, Quality, Attainment), b) Health and Wellness (Survival, Health, Well-being, Sevices), c) Workforce and Employment (Perticapation, Talent, Training), d) Enabling Environment (Infrastructure, Collaboration, Legal Framework, Social Mobility) The Methodology is avaliable on World Economic Forum Portal Too see all data please visit: The Human Capital Report, 2015
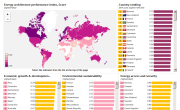
During the past three years, the World Economic Forum has been working on the New Energy Architecture initiative to better understand the changes underway in the global energy system, and how they can be managed to enable an effective transition. A core pillar of this work has been the development of the Global Energy Architecture Performance Index. The EAPI employs a set of indicators to assess and rank the energy architectures of 124 countries. The indicators highlight the performance of each country across the key dimensions of the energy triangle, measuring the extent to which a country’s energy architecture adds or detracts from the economy; the environmental impact of energy supply and consumption; and how secure, accessible and diversified the energy supply is. Using the EAPI can help governments and others along the energy value chain to identify and prioritize areas for improvement. By using consistent data from reliable sources, the EAPI provides a transparent and easily compared set of measures that can help track progress and open new perspectives on the specific challenges faced by every country in each region. Source: Energy Architecture Performance Index, 2014
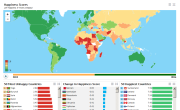
According to the latest World Happiness Report, issued by the Sustainable Development Solutions Network (SDSN) on Apr 23 2015, the happiest countries in the world are Switzerland, Iceland, Denmark and Norway. Four top countries have average scores between 7.5 and 7.6, and the differences between them are not statistically significant. The rest of the top 10 (in order) are Canada, Finland, Netherlands, Sweden, New Zealand and Australia, all with average scores above 7.28. Comparing the country rankings in World Happiness Report 2015 with those in World Happiness Report 2013, there is a combination of consistency and change. Nine of the top 10 countries in 2015 were also in the top 10 of 2013. There is more turnover, almost half, among the bottom of the list. Most are in sub-Saharan Africa, with the addition of Afghanistan and a further drop for Syria and Ukraine because of warfare. Greece, Cyprus and Albania also showed a drop in the happiness level due to economic turmoil. Happiness scores data come from the Gallup World Polls. The rankings are based on answers to the main life evaluation question asked in the poll. This is called the Cantril ladder: it asks respondents to think of a ladder, with the best possible life for them being a 10, and the worst possible life being a 0. They are then asked to rate their own current lives on that 0 to 10 scale. Resulting happiness scores are closely associated with the personal income levels. Generally, people, who live in countries with the larger GDP per capita, tend to be happier. However, the wealth is not only factor that affects happiness. Some countries show significantly higher happiness scores for given per capita GDP (this is typical for Latin America states e.g. Brazil, Panama, Venezuela, Costa Rica, Uruguay, Argentina). Countries that facing worsening economic conditions (such as highly indebted European countries and some in Eastern Europe) and the states with a low level of respect for human rights and high corruption show the opposite tendency (see the bubble chart at the bottom of the page). Source: World Happiness Report 2015
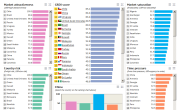
The annual A.T. Kearney Global Retail Development Index ranks the top 30 developing countries for retail expansion worldwide. The Index combines 25 macroeconomic and retail-specific indicators to help retailers devise successful global strategies and to identify developing market investment opportunities. GRDI scores are based on the following four variables: market attractiveness, market saturation, country and business risk and the time pressure, which represents near-term opportunities. Each country ranked on a 0-to-100-point scale—the higher the ranking, the more urgency there is to enter a country. The GRDI is unique because it identifies today's most successful markets and those that offer the most potential for the future. In 2014, GRDI ranks Chile first for the first time. Years of economic and political stability have helped the country build one of South America's most sophisticated retail environments. China moves back into second place this year, but even as the economy slows and conditions become more difficult for foreign retailers, the huge and growing market is impossible to ignore. Uruguay has one of the GRDI's most attractive markets and is ranked 3rd for the second straight year. Source: Global Retail Development Index, 2014. More on A.T.Kearney's web site.0-to-100-point scale—the higher the ranking, the more urgency there is to enter a country. Countries are selected from 200 developing nations based on three criteria: - See more at: http://www.atkearney.com/consumer-products-retail/global-retail-development-index/full-report#sthash.RVmqIfxM.dpuf
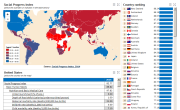
The Social Progress Index is the result of a two-year process guided by a stellar team of experts which includes, among the others, renowned economists Hernando de Soto and Michael Porter and the president of The Rockefeller Foundation Dr. Judith Rodin. The Index synthesizes a huge body of research to identify the dimensions of performance of societies and measure the social progress comprehensively and rigorously. The Index has been structured around 12 components and 54 distinct indicators consolidated into three dimensions of Social Progress: Basic Human Needs, Foundations of Wellbeing, and Opportunity. The first dimension, Basic Human Needs, assesses how well a country provides for its people’s essential needs by measuring whether people have enough food and are receiving basic medical care, if they have access to safe drinking water, if they have access to adequate housing with basic utilities, and if they are safe and secure. Foundations of Wellbeing measures whether a population has access to basic education, ideas and information from both inside and outside their own country, and if they have more than basic healthcare and can live healthy lives. This dimension also measures a country’s protection of air, water, and land, resources critical for current and future wellbeing. The final dimension, Opportunity, measures the degree to which a country’s population is free of restrictions on its rights and its people are able to make their own personal decisions, and whether prejudices or hostilities within a society prohibit individuals from reaching their potential. This dimension also includes the degree to which advanced education is accessible to all those in a country who wish to further their knowledge and skills. Together, this interrelated set of factors produce a given level of social progress as an overall index score. You can explore various countries' developments by selecting the desired index component or indicator in the table. Use the map to select the country of interest and see its detailed socioeconomic profile
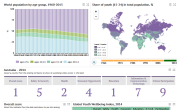
The Global Youth Wellbeing Index collects youth-related data to estimate the state of young people’s wellbeing throughout the world. The Index is designed to elevate youth needs and opportunities along with young people’s participation on national and global issues. It also provides public and private sector decision-makers with a clear vision of today’s youth needs. The Index takes into account 30 countries with both high and low income from five regions, which represent nearly 70% of the world’s youth. Explore which countries provide the best environment for youth by using our heat map table. In order to analyze strengths and weaknesses of different countries in supporting youth, please choose the country of your interest from the ranking. Source: Global Youth Wellbeing Index, 2014 - the dataset from CSIS website *CSIS - Center for Strategic & International Studies
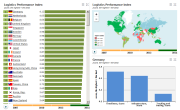
Source: Logistics Perfomance IndexEconomyCrimeDemographicsGDP, current prices USDHomicide RateTotal Population ForecastGDP, PPP current intern. $HomicidesPopulation Growth Rate ForecastGDP per capita, current prices USDPercentage of homicides by firearmPopulation Density ForecastGDP per capita, PPP current intern. $Number of homicides by firearmMedian Age of the Population ForecastForeign Direct InvestmentHomicide by firearm rate Total populationTotal External Debt, USDAssault, ratePopulation Growth RateShare of AgricultureKidnapping, ratePopulation DensityShare of ManufacturingRobbery, rateMedian Age of PopulationShare of ServicesRape, rateMortality rate, under-5Unemployment rateBurglary,rateMortality rate, neonatalConsumer Price IndexTheft, Private Cars, RateMortality rate, infantGoverment Debt, % of GDPTheft, Motor Vehicle, RateDeath rateCurrent Account Balance, USDBurglary/housebreaking ,RateLife expectancy at birthCurrent Account Balance, % of GDP Fertility RateEmployment in agriculture EducationAgricultureEnergyEnrolment Ratio. Pre-primary EducationCrops Production. QuantityTotal Biofuels ProductionEnrolment Ratio. Primary EducationCrops Production. Area HarvestedPrimary Energy ConsumptionEnrolment Ratio. Secondary EducationCrops Production. YieldWind Electricity Net GenerationEnrolment Ratio. Tertiary EducationLive Stock Production. StocksSolar, Tide and Wave ElectricityPublic Expenditures on Education Live Stock Production. QuantityCrude Oil Proved ReservesLiteracy Rate. Adult (15+)Trade. Import QuantityProved Reserves of Natural GasSchool life expectancy. TertiaryTrade. Export quantityProduction of Crude OilOutbound Mobility Ratio (%). TertiaryFood Supply. Quantity (kg/capita/yr)Gross Natural Gas ProductionAcademic Ranking of World UniversitiesFood Supply. Energy (kcal/capita/day)Total Primary Coal Production Total Electricity Net Generation Total Recoverable Coal HealthGovernancePovertyHealth Expenditure Per CapitaCountry Policy and Institutional AssessmentPoverty ratio at $1.25 a dayTotal Health ExpendituresTransformation IndexPoverty ratio at $2 a dayOut-of-pocket health expendituresBetter Life IndexPoverty ratio at national poverty linePrevalence of HIVGlobal Slavery IndexPoverty ratio at rural poverty lineDepth of the food deficitDemocracy IndexPoverty ratio at urban poverty linePrevalence of undernourishmentQuality of Government Institute StandardGINI indexGlobal Snakebits StatisticsThe Rule of Law IndexIncome share held by lowest 10%Immunization, DPTWorld Press Freedom Index, 2014Income share held by highest 10% BusinessCorruptionEnvironmentGlobal Dynamism Index (GDI)Corruption Perception IndexEnvironmental Performance IndexIndex of Economic FreedomFreedom House Nations in TransitGlobal Green Economy IndexSurvey of Mining CompaniesGlobal Business Bribery Risk Index Enabling Trade Index World Bank Doing Business CompetitivenessTransportationProsperityGlobal manufacturing competitiveness indexLogistics Perfomance IndexLegatum Prosperity Index RankGlobal Competitiveness IndexTransportation Price IndexLegatum Prosperity Index Indicators StatisticsFreedomPensionsOpen Data BarometerFreedom in the WorldGlobal AgeWatch IndexMap Data. Open Data Barometer DemocracyFood SecurityResearch and DevelopmentGlobal Democracy RankingGlobal Hunger IndexGlobal Innovation Index Human DevelopmentProperty RightsKnowledgeHuman Development ReportInternational Property Rights IndexKnowledge Economy Index TelecommunicationOcean Exchange RatesNetworked Readiness IndexOcean Health IndexThe Economist Big Mac Index Happiness World Happiness Index
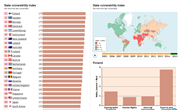
Source: Fragile States Index (FSI)Economy CrimeDemographicsGDP, current prices USDHomicide RateTotal Population ForecastGDP, PPP current intern. $HomicidesPopulation Growth Rate ForecastGDP per capita, current prices USDPercentage of homicides by firearmPopulation Density ForecastGDP per capita, PPP current intern. $Number of homicides by firearmMedian Age of the Population ForecastForeign Direct InvestmentHomicide by firearm rate Total populationTotal External Debt, USDAssault, ratePopulation Growth RateShare of AgricultureKidnapping, ratePopulation DensityShare of ManufacturingRobbery, rateMedian Age of PopulationShare of ServicesRape, rateMortality rate, under-5Unemployment rateBurglary,rateMortality rate, neonatalConsumer Price IndexTheft, Private Cars, RateMortality rate, infantGoverment Debt, % of GDPTheft, Motor Vehicle, RateDeath rateCurrent Account Balance, USDBurglary/housebreaking ,RateLife expectancy at birthCurrent Account Balance, % of GDP Fertility RateEmployment in agriculture EducationAgricultureEnergyEnrolment Ratio. Pre-primary EducationCrops Production. QuantityTotal Biofuels ProductionEnrolment Ratio. Primary EducationCrops Production. Area HarvestedPrimary Energy ConsumptionEnrolment Ratio. Secondary EducationCrops Production. YieldWind Electricity Net GenerationEnrolment Ratio. Tertiary EducationLive Stock Production. StocksSolar, Tide and Wave ElectricityPublic Expenditures on Education Live Stock Production. QuantityCrude Oil Proved ReservesLiteracy Rate. Adult (15+)Trade. Import QuantityProved Reserves of Natural GasSchool life expectancy. TertiaryTrade. Export quantityProduction of Crude OilOutbound Mobility Ratio (%). TertiaryFood Supply. Quantity (kg/capita/yr)Gross Natural Gas ProductionAcademic Ranking of World UniversitiesFood Supply. Energy (kcal/capita/day)Total Primary Coal Production Total Electricity Net Generation Total Recoverable Coal HealthGovernancePovertyHealth Expenditure Per CapitaCountry Policy and Institutional AssessmentPoverty ratio at $1.25 a dayTotal Health ExpendituresTransformation IndexPoverty ratio at $2 a dayOut-of-pocket health expendituresBetter Life IndexPoverty ratio at national poverty linePrevalence of HIVGlobal Slavery IndexPoverty ratio at rural poverty lineDepth of the food deficitDemocracy IndexPoverty ratio at urban poverty linePrevalence of undernourishmentQuality of Government Institute StandardGINI indexGlobal Snakebits StatisticsThe Rule of Law IndexIncome share held by lowest 10%Immunization, DPTWorld Press Freedom Index, 2014Income share held by highest 10% BusinessCorruptionEnvironmentGlobal Dynamism Index (GDI)Corruption Perception IndexEnvironmental Performance IndexIndex of Economic FreedomFreedom House Nations in TransitGlobal Green Economy IndexSurvey of Mining CompaniesGlobal Business Bribery Risk Index Enabling Trade Index World Bank Doing Business CompetitivenessTransportationProsperityGlobal manufacturing competitiveness indexLogistics Perfomance IndexLegatum Prosperity Index RankGlobal Competitiveness IndexTransportation Price IndexLegatum Prosperity Index Indicators StatisticsFreedomPensionsOpen Data BarometerFreedom in the WorldGlobal AgeWatch IndexMap Data. Open Data Barometer DemocracyFood SecurityResearch and DevelopmentGlobal Democracy RankingGlobal Hunger IndexGlobal Innovation Index Human DevelopmentProperty RightsKnowledgeHuman Development ReportInternational Property Rights IndexKnowledge Economy Index TelecommunicationOcean Exchange RatesNetworked Readiness IndexOcean Health IndexThe Economist Big Mac Index Happiness World Happiness Index
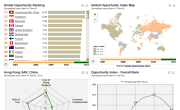
The Global Opportunity Index answers a pressing need for information that's vital to a thriving global economy. What policies can governments pursue to attract foreign direct investment (FDI), expand their economies, and accelerate job creation. What do multinational companies, other investors, and development agencies need to know before making large-scale, long-term capital commitments. The costs and conditions of doing business are central to the FDI equation. Natural resources and hardworking people have great value, of course, as do a sophisticated banking system and healthy industrial base. But countries that invest in their infrastructure, suppress corruption, and maintain sound regulations can claim important advantages. Each one-unit increase in the Global Opportunity Index is associated with a 46 percent increase in FDI per capita. Source : Global Opportunity Index
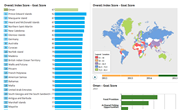
The Ocean Health Index is a valuable tool for the ongoing assessment of ocean health. By providing a means to advance comprehensive ocean policy and compare future progress, the Index can inform decisions about how to use or protect marine ecosystems. The Index is a collaborative effort, made possible through contributions from more than 65 scientists/ocean experts and partnerships between organizations including the National Center for Ecological Analysis and Synthesis, Sea Around Us, Conservation International, National Geographic, and the New England Aquarium. Source: Ocean Health Index, 2014
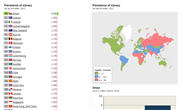
"This is the second edition of the Global Slavery Index, the flagship report of the Walk Free Foundation. The Global Slavery Index estimates the number of people in modern slavery in 167 countries. It is a tool for citizens, non government organisations, businesses and public officials to understand the size of the problem, existing responses andcontributing factors, so they can build sound policies that will end modern slavery. The Global Slavery Index answers the following questions: What is the estimated prevalence of modern slavery country by country, and what is the absolute number by population? How are governments tackling modern slavery? What factors explain or predict the prevalence of modern slavery?" Source: Global Slavery Index
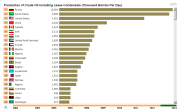
Top crude oil producing countries
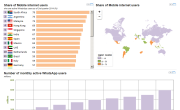
WhatsApp is a cross-platform instant messaging service for smartphones that relies on the internet for the transmission of messages. As of April 2014, the mobile messenger has more than 500 million monthly active users worldwide and ranks as one of the most popular mobile social apps globally. Based on a low-cost subscription model, WhatsApp is a cheap alternative to carrier-billed text messaging via SMS, especially for international or group messaging. The mobile messaging app enables users to share text, image and video messages – the service handles more than 600 million photo and 64 billion overall messages every day. In the United States, the daily engagement rate among Android WhatsApp users was 36 percent. Recent market data indicates that the majority of WhatsApp users in the United States are aged between 25 and 34 years and that the app enjoys a strong U.S. Hispanic user base. Source : Statistics and facts about WhatsApp
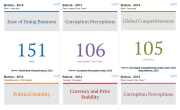
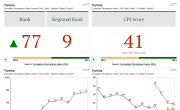
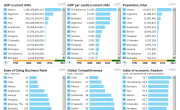
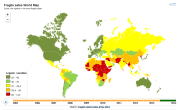
The Fragile States Index is an annual ranking of 178 nations based on their levels of stability and the pressures they face. The Index is based on The Fund for Peace’s proprietary Conflict Assessment System Tool (CAST) analytical platform. Based on comprehensive social science methodology, data from three primary sources is triangulated and subjected to critical review to obtain final scores for the Fragile States Index. Most Worsened (Non-Top 10) Country for 2014: Syria Most Improved Country for 2014: Iran
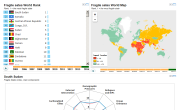
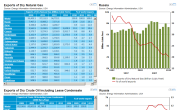
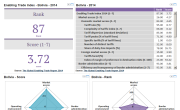
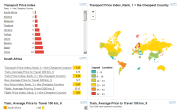
India is considered to be the country with the lowest cost of travelling by air. Average price to travel 100 km by plane in this country is $10.4. Noteworthy that India is one of two countries - the second is United States - where travelling by air is cheaper than travelling by train: in both countries the difference is about 5 dollars. On the opposite side of the ranking traditionally expensive European countries are located with Finland at the top: one hundred kilometers flight in this country costs in average $139. Concerning cost of railroad trip, South Africa is the cheapest country followed by Georgia and Egypt. The latter, in turn, is the country with the lowest price for 100km bus trip which constitutes a bit less than $2: so, bus trip through the whole country from west to east will cost 20 dollars. While bus, as a rule, is considered to be comparatively cheap transport mode, in some countries it is even more expensive than plane. The examples of such countries are Netherlands and Australia. Thus, in Netherlands flight is cheaper than bus travel by 4 dollars, while in Australia the difference is bigger by 50 cents. All in all, average cost of transportation by all three modes is the lowest in South Africa, Albania, Malaysia and Thailand and the highest in Switzerland, Austria, Belgium and Israel. See also: Comparison of Price to Travel by Different Transport Modes
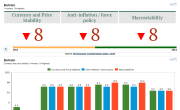
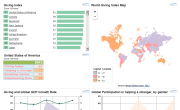
The World Giving Index score is based on an average of three measures of giving behaviour - the percentage of people who, in a typical month, donate money to charity, volunteer their time, and help a stranger. The three behaviours are also looked at on an individual basis within the report. This year’s report shows that, though the pace of economic expansion has slowed, the levels of involvement in giving – for all three measures – has increased on last year's results. However, looking at the longer term, only the percentage of people saying that they have helped a stranger has exceeded 2008 levels. Key findings and conclusionsThe United States has reclaimed first place in the World Giving Index.Giving has bucked a trend, growing in 2012Helping a stranger is the key to the rise in giving to charityThe most substantial growth is in the number of people helping strangersGlobal youth are driving the rise in volunteering Source: World Giving Index
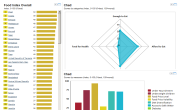
Global food system is far from perfect: even though there is enough food for everyone on Earth ones go to bed hungry every night while others suffer from obesity and overweight. What is wrong with our food system which cannot provide people with enough of the right food and what could be done to treat these failings? "The Good Enough to Eat Index" is the effort of OXFAM - international organization tackling poverty across the world – aimed exactly at addressing these issues. Capturing data from 8 different established sources for 125 countries, the Food Index depicts current situation in 4 main spheres of food system by means of 8 standardized indicators (2 indicators per each sphere). These spheres are: sufficiency of food ("Enough to Eat" sub index), affordability of food ("Afford to Eat" sub index), quality of food (cognominal sub index) and impact of food on people's health ("Food for Health" sub index). Combined together, these sub-indices constitute the resulting food index giving an idea of overall quality of a country's food system. At the same time, consideration of index by components or indicators highlights some of the fields of critical concern and failures of both global and country-level food systems. Both the overall index and its components including indicators are standardized values ranging from 0 to 100 where 0 represents the best possible score and 100 is the worst possible score. See also: Food Security | Global Food Security Index | Global Hunger Index Report, 2013 Source: OXFAM Global Food Index, 2014
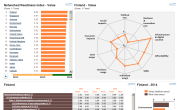
The Networked Readiness Index (NRI), developed by the World Economic Forum in the frame of Global Information Technology Report, which is considered as the most comprehensive and authoritative international assessment of its kind, depicts the current stage of progress made in the world towards leveraging ICT (Information and Communication Technologies) to boost productivity, economic growth, employment creation and, as a result, increasing the returns. The key to such leveraging is focusing on a value which ICT brings to the economy and society. Rapid development of ICT, or, in other words, digitization, along with opportunities it creates for business is also distracting in some measure as it presents puzzling range of potential opportunities, all of which seem attractive. That is why it is keenly important to prudently and rigorously select opportunities of digitization in order to extract from them maximum value. One more crucial thing which is needed to be done to achieve this goal is to bridge the digital divide - the divide between countries that are achieving positive economic and social impacts related to the use of ICTs and those that are not. All these issues have defined multifaceted nature of the Networked Readiness Index: it embraces 4 dimensions of ICT - environment (political, regulatory and business environment), ICT readiness (infrastructure, affordability and skills), ICT usage (by individuals, business and government) as well as impact of ICT (both economic and social). Such comprehensive nature on index, along with its broad geographical coverage (148 countries accounting for 98% of world GDP) makes it useful instrument which provides policymakers, business leaders, and concerned citizens with valuable insights into current market conditions and the state of connectivity across the world. Source: Networked Readiness Index (NRI), 2014
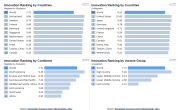
By considering the population of a country, the most Innovative Country appears to be Switzerland, whereas by ignoring population, United States is the most Innovative Country. Below is a brief info graphics on Top innovating countries in the world. Source: Knowledge Economy Index from World Bank