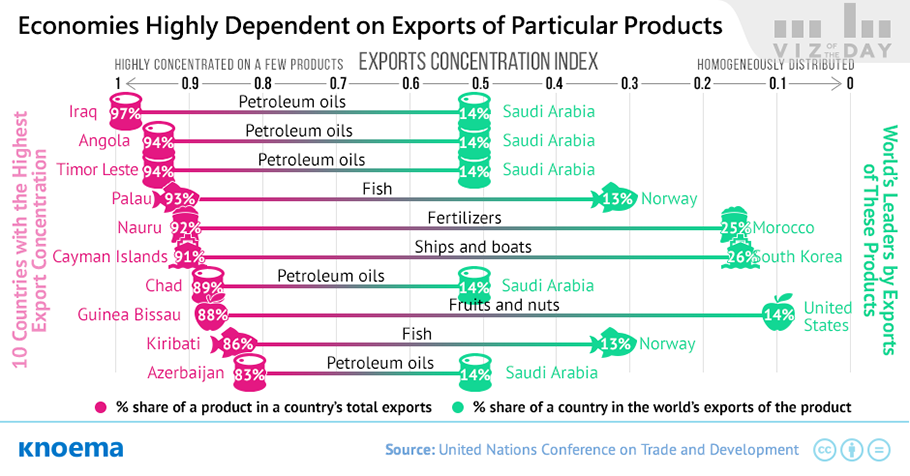
The concentration index of exports estimates a country’s reliance on a limited group of commodities as its primary source of foreign exchange income. Ranging from 0 (perfect diversification) to 1 (concentrated on a single product)*, a comparison of index scores to the contribution of natural resources to GDP worldwide shows that countries that are resource-rich tend to have less diversified export bases.

  • Last year Iraq’s export concentration index reached 0.97, driven by its export concentration in mineral fuels, namely oil. Other oil exporters—including Angola, Iran, Kuwait, and Nigeria, among others—likewise have high concentration scores. While mineral fuels exports make up a relatively lower percentage of Russia’s export income—approximately 63% in 2015—the collapse of global oil prices has still had a pernicious effect on Russia's economy, according to the World Bank.
  • Precious or semi-precious stones and metals are another common commodity exported by countries with high concentration scores. Botswana is one of the world’s leading sources of mined diamonds, which made up 84 percent of the country’s exports in 2015.
  • South Korea has a relatively high export concentration score compared to other developed countries, but unlike developing country examples, South Korea is not a raw-material producer. Slightly more than half of Korea’s exports are concentrated in machinery manufacturing, with primary exports including ships, cars, computers, and other electronic items.

Export concentration is a concern for economic planners worldwide but less so in most developed economies which tend to maintain more diversified export profiles. In fact, the world's leading exporters of particular products are not concentrated on the export of those same products, decreasing their vulnerability to changes in global demand and the corresponding ebb and flow of export earnings that bring in foreign exchange.

  • For example, while Norway is the largest exporter of fish in the world, fish makes up less than 10 percent of its exports. The same is true for South Korea: ships and boat exports constitute only 7 percent of the country's total experts even though it is the world's top exporter of these products.
  • Developed economies diverse export bases thus theoretically made them more capable of coping as world exports decreased by 19 percent in 2015 (total value of $3.5 billion) and global exports of oil were slashed in half.
  • Based solely on export concentration scores, Italy would be considered lowest risk in terms of economic distress from changes in global demand, as it has long held the lowest score on the index. The countries of the European Union, in general, maintain low export concentration scores.

*The index is calculated as a sum of squared shares of products constituting a country's exports.

Aperçus connexes de Knoema

China Trade Data | Latest Official Statistics

(October 2019) China and the United States reached a partial trade deal on Friday, October 11, with the US agreeing to forgo further tariff escalation in exchange for China agreeing to resume purchases of US farm products. However, even if trade terms improve between the countries, recent preliminary figures released by China's customs office suggest Chinese exports hurt by the trade war will need time to recover to 2018 levels. Since the beginning of 2019, China exported $348 billion to the United States, 11.3 percent less than during the same period of 2018.China's exports...

World Trade Uncertainty Weighing On Global Growth

Recent analysis from the IMF cites increasing uncertainty caused by trade tensions as a primary driver of sluggish global growth, a trend which moved the IMF to issue a downward revision to its global GDP growth forecast in the July edition of the World Economic Outlook. According to IMF estimates, the escalation of trade uncertainty observed this year could consume around 0.75 percentage points of global growth in 2019. To track trade tensions globally, the IMF and Stanford University teamed up to develop the World Trade Uncertainty Index (WTU).* This index measures trade...

US Agricultural Exports to China Falling, Farmers Seek New Markets

Ask any American soybean farmer about current market conditions and US-China trade frictions will bubble up in the conversation. After the late June meeting between presidents Xi Jinping and Donald Trump in Osaka, Trump assured American farmers that trade talks would resume and that China would buy a tremendous amount of food and agricultural products very soon. Yet, in the month since, no significant purchases have been announced and no information is publicly available on large purchases in the offing, especially now, as the trade-war escalated again with the new 10-percent...

US-China Trade War: First Signs of Thaw

Weeks after US President Donald Trump and Chinese President Xi Jinping agreed to a temporary halt in the US-China trade war, the first positive signs of a return to normal trade relations are emerging. Last week, the China Grain Reserves Corporation (Sinograin) and fellow state-run Chinese enterprise Cofco bought more than 1.5 million tons of US soybeans, the first significant deal since the countries agreed to a 90-day truce from December 1, 2018, to March 1, 2019. The announcement caused a spike in soybean futures to $918.5 a bushel, the highest price since June. Soybeans were...